How to monitor Wordpress with Datadog
Welcome to the world of web domination, where WordPress stands as one of the web’s driving forces. While there’s a plethora of hosting…

Welcome to the world of web domination, where WordPress stands as one of the web’s driving forces. While there’s a plethora of hosting options available, navigating the intricacies of a self-deployed WordPress brings its own set of challenges. How do you ensure it’s not just running but thriving, free from any lurking issues?
In this article, we’re about to elevate your WordPress game. Buckle up as we embark on a thrilling expedition to instrument WordPress with the insights Datadog has to offer. This isn’t just about a trial run; it’s a roadmap to ensure each step adds substantial value. Brace yourself as we dive into the intricacies of deploying multiple Datadog products, transforming your WordPress monitoring game in a Kubernetes environment.
Ready to transform your WordPress experience? Let’s dive in and uncover the secrets to a seamlessly monitored WordPress deployment! 🚀🔍
For the initial setup, the initial deployments file used are MySQL Deployment with this secret used as well as this Wordpress Deployment.
Core and foundation
System and Kubernetes data
Embarking on our journey, the first stop is to capture the heartbeat of our system — the infrastructure metrics. But fear not, for this isn’t a complicated endeavor; it’s a simple dance with Datadog. Picture this: you can achieve this feat with just a few taps of your keyboard.
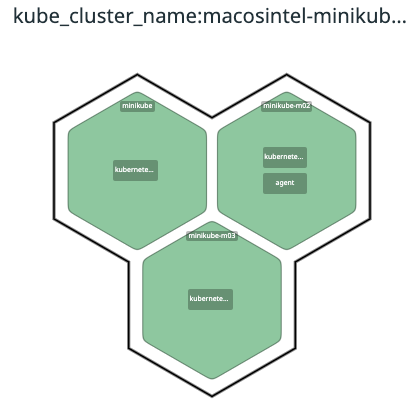
Install the Datadog agent on your Cluster, and for the ultimate convenience, consider using the Datadog Operator. Need a guiding star? Here’s a link to illuminate your path. On my adventure, I opted for a quick deployment using a nifty config file for the Operator. What does this lead us to with this simple trick? The collection of system metrics, live processes, and the harvesting of container metadata.
Ready to witness your system data illuminate your dashboards? It all begins with this simple act. Let’s dive in and give your WordPress infrastructure the wings it deserves! 🚀💻
# https://github.com/DataDog/datadog-operator/blob/main/docs/configuration.v2alpha1.md
apiVersion: datadoghq.com/v2alpha1
kind: DatadogAgent
metadata:
  name: datadog
spec:
  global:
    site: datadoghq.com
    credentials:
      apiSecret:
        secretName: datadog-secrets
        keyName: api-key
      appSecret:
        secretName: datadog-secrets
        keyName: app-key
    clusterName: macosarm-minikube
    tags: ["env:sandbox","owner:narbais","version:20240115","laptop:macosarm"]
    kubelet:
      tlsVerify: false # default: true
  features:
    eventCollection:
      collectKubernetesEvents: true
    kubeStateMetricsCore:
      enabled: true
    admissionController:
      enabled: true
    clusterChecks:
enabled: trueCongratulations! At this stage, your system is whispering a wealth of information, and it’s time to tune into the symphony of insights. Imagine having a backstage pass to everything — from your deployment details (yes, everything you get from a casual ‘kubectl get’), to a dazzling display of the processes within your containers. And that’s not all; brace yourself for a visual feast of system metrics — CPU, Mem, Disk — and Kubernetes metrics, CPU and memory from containers, replica count, and containers in error, just to name a few.
Why does this matter? Because these insights unveil the magic behind your deployment. Is it seamlessly tangoing through the digital stage, or is there a hiccup? Is the memory consumption getting close to the limits, and is Kubernetes itself running flawlessly?
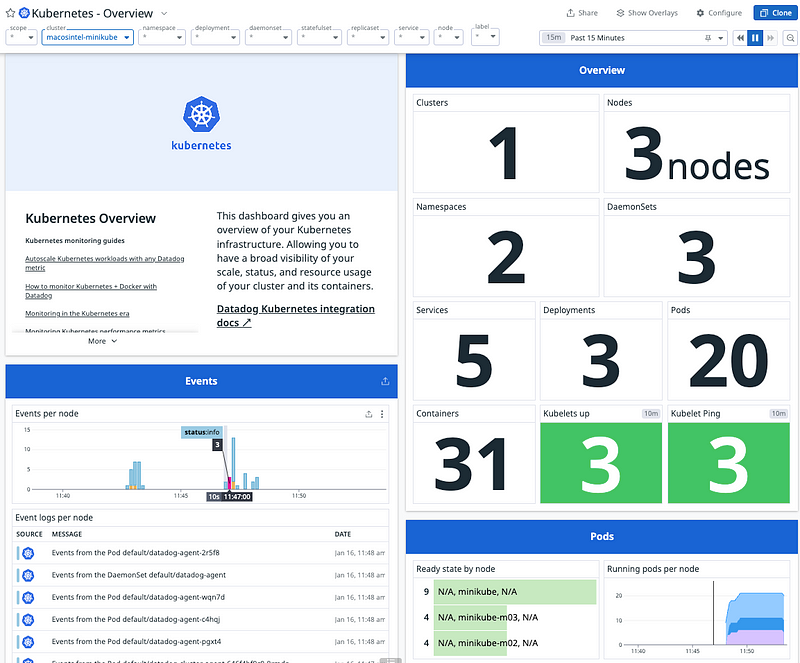
Here’s a pro-tip: while you’re reveling in this treasure trove of information, don’t forget to unleash the full potential by enabling integrations on the integration page. Oh, and the cherry on top? Explore the wonders of Datadog’s default dashboards. Your journey is about to get even more thrilling! 🎉📊
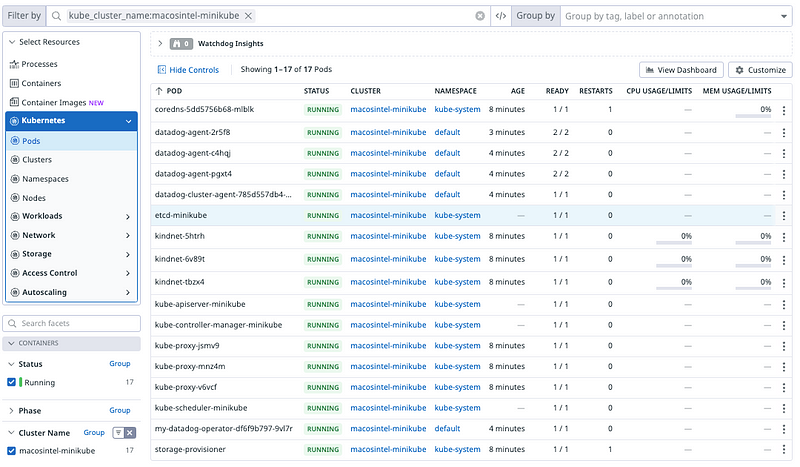
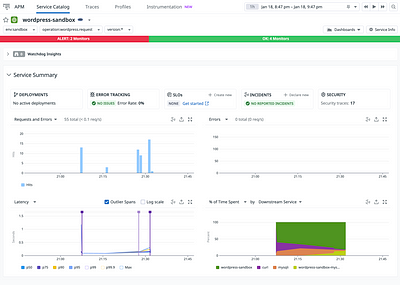
Datadog screenshot of wordpress deployment
Apache and MySQL
Now, let’s turn our spotlight onto our backstage solutions — Apache and MySQL — the pillars on which WordPress gracefully runs. To unlock the secrets within these core technologies, we’re about to perform a magic trick: setting up integrations for both containers. And here’s the best part — it’s as simple as a few config file changes, or in our case, leveraging the autodiscovery annotations and giving your containers a swift redeployment.
Imagine the flood of insights waiting to be unleashed — Apache’s performance metrics and MySQL’s rhythmic heartbeat, all at your fingertips. Ready to turn your WordPress monitoring from good to spectacular? Follow along as we unravel the magic behind these integrations. Your WordPress experience is about to hit a whole new crescendo! 🎩✨
For MySQL, nothing is simpler than adding those annotations. Of course, make sure to follow the doc instructions and create the relevant user first within your database
# Connect within MySQL pod to perform the requests
kubectl exec -it <POD_NAME> - mysql -u root -p # YOUR_PASSWORD
annotations:
ad.datadoghq.com/mysql.check_names: '["mysql"]'
ad.datadoghq.com/mysql.init_configs: '[{}]'
ad.datadoghq.com/mysql.instances: |
[
{
"server": "%%host%%",
"user": "datadog",
"password": "YOUR_PASSWORD"
}
]For Apache, this requires a few changes first on the wordpress container. First make sure mod_status is enabled to expose the Apache metrics of interest. For that, I’d recommend to follow this tutorial or make sure that the file under `/etc/apach2/mods_enabled/status.conf` includes `Require all granted`.
# /etc/apach2/mods_enabled/status.conf
…
     <Location /server-status>
        SetHandler server-status
        #Require local
        Require all granted
        #Require ip 192.0.2.0/24
      </Location>
…
Now, this needs to be overridden before the container starts so I used a ConfigMap on my side to override the underlying file. In addition, just this will give you a 404 under http://<pod_ip>/server_status. This is due to the .htaccess which is rewriting the URL for wordpress. For that purpose I also had to overwrite it to add the line `RewriteCond %{REQUEST_URI} !=/server-status`
# /var/www/html/.htaccess
# BEGIN WordPress

RewriteEngine On
RewriteRule .* - [E=HTTP_AUTHORIZATION:%{HTTP:Authorization}]
RewriteBase /
RewriteRule ^index\.php$ - [L]
RewriteCond %{REQUEST_FILENAME} !-f
RewriteCond %{REQUEST_FILENAME} !-d
# https://serverfault.com/questions/466734/apache-server-status-returning-404-then-redirecting-to-my-wordpress-install
RewriteCond %{REQUEST_URI} !=/server-status
RewriteRule . /index.php [L]

# END WordPress
Once those two files are edited, the metrics are now exposed and we can use the annotations on the pod to ask the Datadog Agent to crawl the new information exposed.
annotations:
        ad.datadoghq.com/wordpress.checks: |
          {
            "apache": {
              "init_config": {
                "proxy": { "skip_proxy": true }
              },
              "instances": [
                {
                  "apache_status_url": "http://%%host%%/server-status?auto"
                }
              ]
            }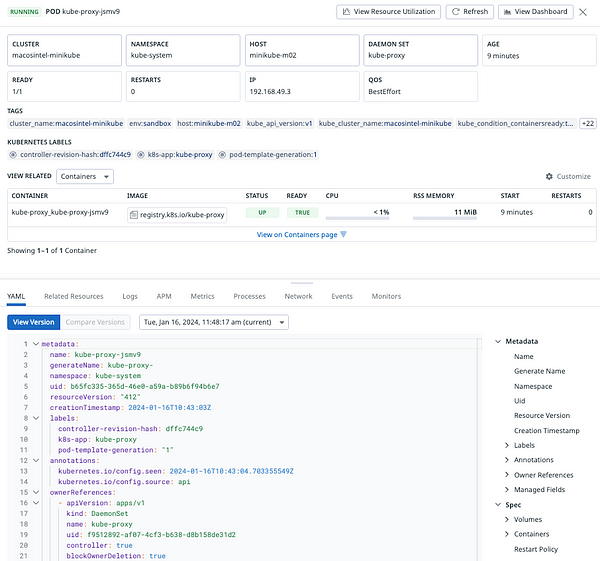
}This will give me insight on the underlying technologies Wordpress is relying on. Again, enable the integrations in the platform and check the standard dashboards provided.
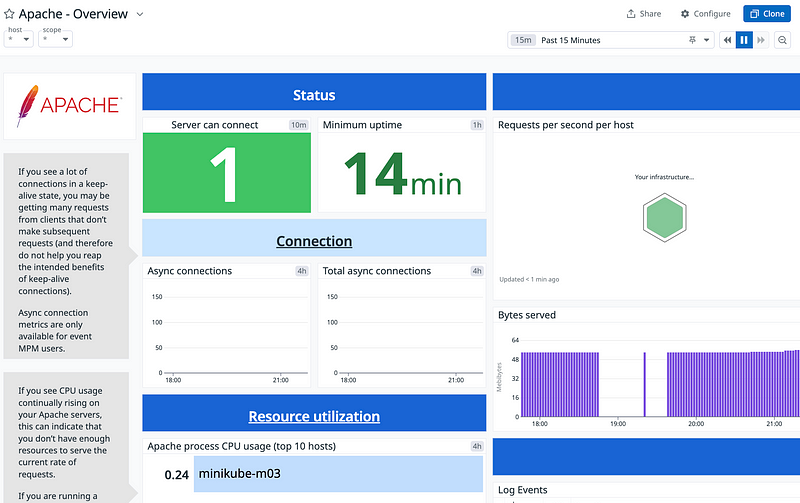
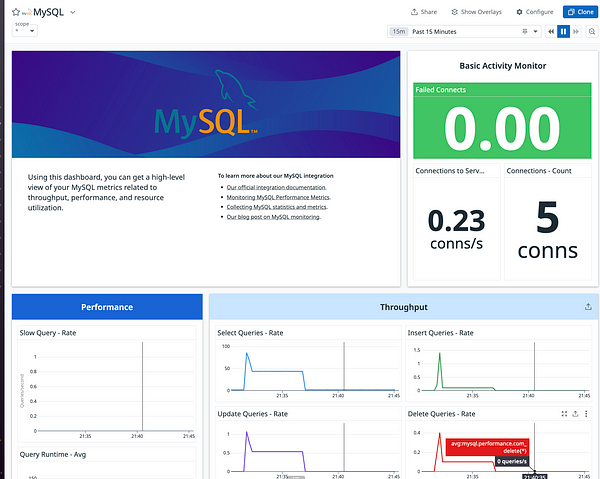
Integration for Apache and MySQL setup
Logs and APM
Logs
Now, let’s add another layer to our WordPress monitoring — the soulful melodies of logs. Brace yourself, because this is the part where simplicity takes center stage. Picture this: a swift change in the config file, a magical application to the operator, and voilà! The operator, like a diligent wizard, works its magic, slowly deploying the new agent config across the entire cluster. The logs will just like that get collected and be available in Datadog.
Ready to let the logs sing the tales of your WordPress adventure? Follow this enchanted path, tweak the config, and watch the magic unfold across your entire cluster! 🎶✨
# https://github.com/DataDog/datadog-operator/blob/main/docs/configuration.v2alpha1.md
apiVersion: datadoghq.com/v2alpha1
kind: DatadogAgent
metadata:
  name: datadog
spec:
  global:
    site: datadoghq.com
    credentials:
      apiSecret:
        secretName: datadog-secrets
        keyName: api-key
      appSecret:
        secretName: datadog-secrets
        keyName: app-key
    clusterName: macosarm-minikube
    tags: ["env:sandbox","owner:narbais","version:20240115","laptop:macosarm"]
    kubelet:
      tlsVerify: false # default: true
  features:
    eventCollection:
      collectKubernetesEvents: true
    kubeStateMetricsCore:
      enabled: true
    admissionController:
      enabled: true
    clusterChecks:
      enabled: true
    logCollection:
      enabled: true
      containerCollectAll: true
Datadog Operator config file (with APM)
With the logs gracefully streaming in, it’s time to wield the power of relevance. This is where you transform from a mere collector of data to the maestro orchestrating the symphony of your logs and using Logging without Limits (LwL) to adjust value and cost.
Take a moment to inspect each log through the pattern feature, separating the signal from the noise. Apply the principles of LwL to your advantage. Picture it as a filter, letting through only the logs that matter to your WordPress orchestration.
For instance, consider sparing your index from logs bearing the pattern below by setting an exclusion filter and not index those.
10.244.2.13 - - [dd/MMM/yyyy:HH:mm:ss xx] "GET /server-status?auto HTTP/1.1" [200–404] [493–47009] "-" "Datadog Agent/7.47.1"parsing rule
%{ipv4:network.client.ip}\s+-\s+-\s+\[%{date("dd/MMM/yyyy:HH:mm:ss Z"):date}\]\s+\"%{word:http.method}\s+%{notSpace:http.url}\s+HTTP%{notSpace:http.url_1}\"\s+%{integer:http.status_code}\s+%{integer:token_1}\s+\"-\"\s+\"Datadog\s+Agent%{notSpace:http.url_2}\"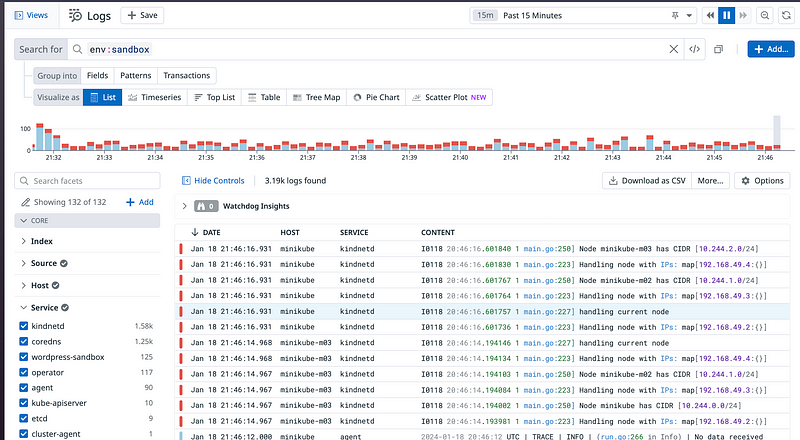
APM and Profiling
Hold onto your hats because our WordPress journey is hitting a crescendo! As we sail through the digital seas, the Google SRE book whispers a golden rule — collect the RED metrics for every service deployed. It’s not just a suggestion; it’s the secret sauce for robust performance.
Enter the realm of Application Performance Monitoring (APM) where magic and metrics converge. We’re about to unveil the power of auto-instrumentation. In this journey, crafting a new Dockerfile is our ticket to unleashing this powerhouse since it will include the relevant libraries for PHP to generate traces.
Ready to infuse your WordPress service with the magic of RED metrics? Grab your coding wand, follow the incantation, and let the enchantment begin! 📈🔮
Add the new configuration to the Datadog Operator to ensure the Agents are accepting traces.
apm:
      enabled: true
Datadog Operator config file (with APM)
And we will simply follow the rest of the doc by including the relevant libraries and parameters to create traces.
FROM wordpress:6.2.1-apache

RUN curl -LO https://github.com/DataDog/dd-trace-php/releases/latest/download/datadog-setup.php

RUN php datadog-setup.php --php-bin=all --enable-appsec --enable-profiling

ARG env[DD_ENV]=$DD_ENV
ARG env[DD_SERVICE]=$DD_SERVICE
ARG env[DD_VERSION]=$DD_VERSION
ARG env[DD_TRACE_SAMPLE_RATE] = $DD_TRACE_SAMPLE_RATE
ARG env[DD_PROFILING_ENABLED] = $DD_PROFILING_ENABLEDOnce the Dockerfile is created, make sure to create the new image and host it or if you are like me on Minkube, make sure to import this image in your cluster.
docker build -t wordpress-apm .
minikube image load wordpress-apm
minikube image ls - format table
Now the last piece of work is to include the relevant annotations and environment variables to the wordpress pod to make sure the service name is correct, the version, the environment and that the sockets are properly mounted to transmit the traces from the app to the Datadog Agent.
Hold onto your digital hats because we’ve just opened a treasure trove of insights! Beyond the mere check of whether your customer-facing pages are doing the expected jig, we’re now equipped to unravel the mysteries that lie beneath. Ever wondered where that pesky issue originates, be it from external plugins or the labyrinthine depths of your MySQL DB?
But wait, I’ve got something special in store for you — a live demo (or at least a few screenshots)! Picture this: I’ll install a plugin with an external dependency, just for the thrill of it. Together, we’ll peer into the mystical realm of traces and witness the magic unfold when our WordPress dance calls upon something external.
This isn’t just a demonstration; it’s a journey into the heartbeat of your WordPress infrastructure. Ready to explore the intricate threads that weave your digital tale? Let’s dive in and unveil the dance of traces in action! 🕵️♂️✨
Wordpress deployment file with APM enabled
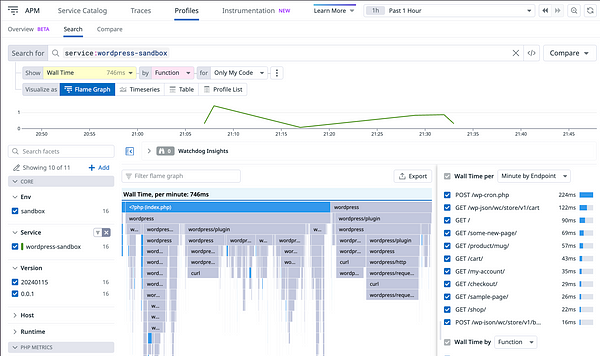
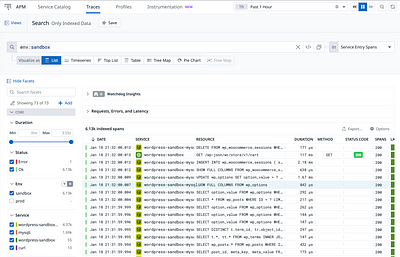
APM setup for Wordpress
Going further with DBM
Hold tight, because we’re about to embark on a thrilling expedition into the beating heart of your database! We’ve already set the stage with basic integrations to capture default metrics, but now it’s time to dive deeper. Picture this as the Sherlock Holmes moment for your database — we’re talking about Database Monitoring (DBM) to unravel the mysteries behind each query and its impact on your database’s performance.
Now, here’s the real magic: with a few enchantments on your database itself and a sprinkle of config file wizardry, we’re ready to amplify our understanding. Say hello to explain plans and a deeper dive into the intricate dance of interactions with your database.
Feeling adventurous? Follow this mystical link here, and let’s uncover the secrets your database has been yearning to reveal. Brace yourself for a journey into the database depths that will forever transform the way you perceive your WordPress infrastructure! 🕵️♂️🔍✨ Overall, just a few more changes and permissions to give within your database, for the configuration, the simple “dbm”: “true” is necessary.
annotations:
ad.datadoghq.com/mysql.check_names: '["mysql"]'
ad.datadoghq.com/mysql.init_configs: '[{}]'
ad.datadoghq.com/mysql.instances: |
[
{
"dbm": "true",
"server": "%%host%%",
"user": "datadog",
"password": "YOUR_PASSWORD"
}
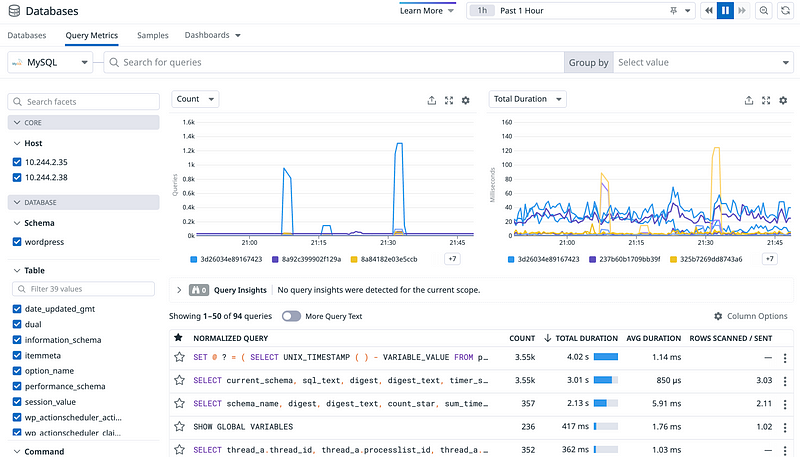
]MySQL deployment file with DBM enabled
Frontend Monitoring
Now that the gears are turning smoothly on the infrastructure side, let’s get up close and personal with your users through the magical realms of Synthetics and Real User Monitoring (RUM). It’s like bringing a front-row seat to the grand theater of your WordPress experience!
Imagine Synthetics as your trusty guardian, meticulously ensuring that the critical flows of actions unfold flawlessly. Especially for an ecommerce website, we want to wave our digital wand and ensure every charm is working as expected. Pro-tip on this magical journey: make your tests idempotent, crafting spells that are repeatable without altering the data beneath.
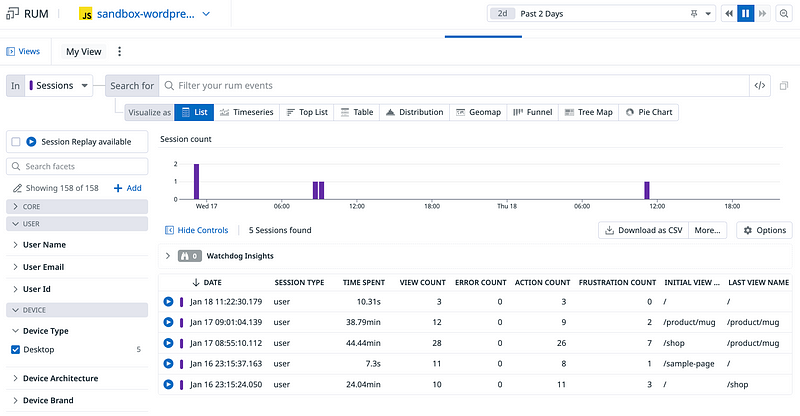
But that’s not all! Want an even closer look into the user’s magical journey? Say hello to RUM! To unlock this treasure, meet your digital ally — WPCode, a plugin designed just for you. Install this plugin, weave the Datadog RUM Javascript into your digital tapestry, and witness the unfolding drama from the user’s perspective. It’s a magical lens, although beware the blockers of ads! This lens reveals intricate details — performance quirks across countries, frontend errors whispered by plugins using the enchantment of JS.
Feeling the thrill? Dive into this enchanted guide here, and let’s paint a vivid picture of your WordPress experience, capturing every nuance from your user’s eyes! 🌟👁️✨
<script>
  (function(h,o,u,n,d) {
    h=h[d]=h[d]||{q:[],onReady:function(c){h.q.push(c)}}
    d=o.createElement(u);d.async=1;d.src=n
    n=o.getElementsByTagName(u)[0];n.parentNode.insertBefore(d,n)
  })(window,document,'script','https://www.datadoghq-browser-agent.com/us1/v5/datadog-rum.js','DD_RUM')
  window.DD_RUM.onReady(function() {
    window.DD_RUM.init({
      clientToken: 'pub1f1234',
      applicationId: 'f0b0000b-cccc-4040-xxx', // your appid
      site: 'datadoghq.com',
      service: 'sandbox-wordpress',
      env: 'sanbdox',
      // Specify a version number to identify the deployed version of your application in Datadog
      version: '1.0.0',
      sessionSampleRate: 100,
      sessionReplaySampleRate: 100,
      trackUserInteractions: true,
      trackResources: true,
      trackLongTasks: true,
      defaultPrivacyLevel: 'mask-user-input',
    });
  })
</script>
For Synthetics, as soon as you expose your website to the public, simply record a browser test and check that adding items to a cart is working.
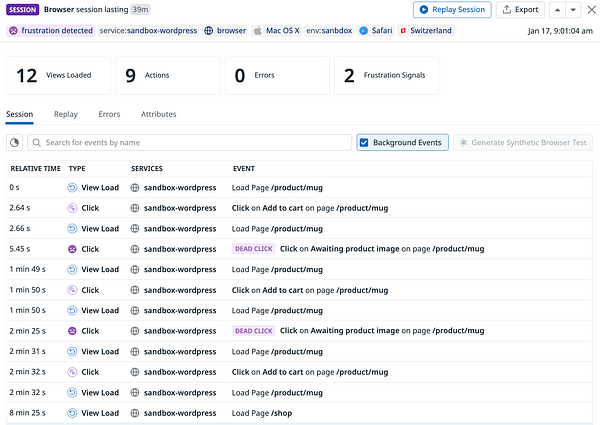
Synthetics tests
Correlation
In the realm of troubleshooting, collecting vast telemetry is essential. Yet, the true power lies in seamlessly connecting these artifacts, connecting insights that can swiftly guide you through the labyrinth of incidents. Imagine a realm where incident responders can navigate effortlessly, saving precious time as they seek the root cause hidden within the depths of the data.
So let’s connect the dots across diverse telemetry sources. The magic begins with the automatic connection of traces to logs. In our journey, no additional efforts are needed in most cases.
But the adventure doesn’t end there. What about connection Real User Monitoring (RUM) and traces, a link that elevates your troubleshooting prowess on your end to end monitoring journey. Check out the details within this document here, and witness the seamless integration of RUM and traces. Note, make sure to select the right sampling criteria to optimize cost and value.
<script>
  (function(h,o,u,n,d) {
    h=h[d]=h[d]||{q:[],onReady:function(c){h.q.push(c)}}
    d=o.createElement(u);d.async=1;d.src=n
    n=o.getElementsByTagName(u)[0];n.parentNode.insertBefore(d,n)
  })(window,document,'script','https://www.datadoghq-browser-agent.com/us1/v5/datadog-rum.js','DD_RUM')
  window.DD_RUM.onReady(function() {
    window.DD_RUM.init({
      clientToken: 'pub1f570df434dbd3e79a06432cf17fd182',
      applicationId: 'f7b7662b-cccd-40af-a8b2-e7cf1bd9d181',
      site: 'datadoghq.com',
      service: 'sandbox-wordpress',
      env: 'sanbdox',
      // Specify a version number to identify the deployed version of your application in Datadog
      version: '1.0.0',
   // https://docs.datadoghq.com/real_user_monitoring/connect_rum_and_traces/?tab=browserrum#setup-rum
   allowedTracingUrls: ["http://localhost", /https:\/\/.*\.my-api-domain\.com/, (url) => url.startsWith("https://api.example.com")]
      sessionSampleRate: 100,
      sessionReplaySampleRate: 100,
   traceSampleRate: 100
      trackUserInteractions: true,
      trackResources: true,
      trackLongTasks: true,
      defaultPrivacyLevel: 'mask-user-input',
    });
  })
</script>
When it comes to WordPress, connecting the dots between data sources may not wield as much power due to its unique nature. However, for conventional applications, this interconnection holds the potential to be a game-changer, significantly impacting your Mean Time To Resolution (MTTR). It’s like having a map that connects the dots for you when you really need it and guides you swiftly to the heart of any issue.
While the bond may not be as important for WordPress, I’d recommend you to embrace the practice for all applications as a standard. 🌐⚡🔗
Conclusion
Congratulations, wizard of WordPress instrumentation! You’ve just woven a tapestry of monitoring magic, ensuring the high-level spells are cast flawlessly and the underlying technologies dance in perfect harmony. But as the wise old sages say, the journey never truly ends.
As you stand at this enchanted crossroads, my humble advice is to set monitors, the guardians that whisper in your ear when things deviate from the norm. Because in the ever-evolving landscape of the digital realm, a watchful eye is your best ally.
And fear not, for future chapters await. Imagine crafting your own custom metrics such as the revenue generated, enriching the threads of your traces and RUM sessions with the content of a cart, and fortifying your setup with security solutions. The adventure continues, and your WordPress realm is ready for exploration.
May your WordPress journey be ever thrilling and your monitoring spells forever potent! Until next time, happy monitoring! 🧙♂️🌐🔮


![[Youtube] Mastering Synthetic Monitoring with Datadog: A Practical Guide](https://images.unsplash.com/photo-1460925895917-afdab827c52f?crop=entropy&cs=tinysrgb&fit=max&fm=jpg&ixid=M3wxMTc3M3wwfDF8c2VhcmNofDJ8fHdlYnxlbnwwfHx8fDE3NTM4MjMzMjh8MA&ixlib=rb-4.1.0&q=80&w=600)