Observability at Scale: The strengths of Metrics, Logs, and APM
In the dynamic landscape of modern technology, Observability stands tall, fortified by a multitude of pillars designed to empower…

In the dynamic landscape of modern technology, Observability stands tall, fortified by a multitude of pillars designed to empower developers in unraveling the intricate behavior of their systems. Amidst this complexity, the three foundational pillars — Infrastructure/Metrics, Logs, and APM — remain the cornerstone for achieving comprehensive observability.
In this discourse, we embark on a journey to dissect these three pillars, elucidating their benefits, constraints, and scalability factors. Drawing from my experiences with Datadog, we aim to provide actionable insights to aid in navigating the maze of observability requirements and guide on which pillar is the right choice.
Infrastructure and Metrics: The Bedrock of Observability
An ever-expanding array of technologies now divulge metrics via open endpoints or other methods, offering a panoramic view of system behavior. Metrics, with their innate ability to furnish high-level insights into system performance, are a cornerstone of observability. Their benefits lie in the cost-effectiveness of long-term storage, even though the cardinality of underlying data is to be taken into consideration.
In this context of observability, cardinality typically refers to the number of unique values or distinct entities within a dataset or system. It’s a measure of the diversity or variability of data points or components that are being observed.
For example, in monitoring a distributed system, cardinality might refer to the number of unique IP addresses accessing a service, the number of unique endpoints being called, or the number of distinct error codes being generated. High cardinality implies a wide range of different values or entities, which can pose challenges for observability tools and require more sophisticated analysis techniques to derive meaningful insights.
Indeed, while metrics excel in offering macroscopic insights and trend analysis, they may fall short in delving into root causes and need to be supported by other pillars. They are however a core pillar for notifying users, initiating troubleshooting or simply analyzing long term changes. In addition, their cost structure remains resilient, unaffected by the volume of data points, but rather contingent upon cardinality. Note that even for open source solutions, high cardinality metrics will often slow down the querying system.
Scalability, the hallmark of modern systems, finds an ally in metrics, especially in scenarios necessitating granular data and increased data points. Yet, it is important to keep in check the cardinality. For instance, a metric looking at the value of a shopping cart per user will see its cardinality explode when the number of users increases whereas the total revenue per entity will have a stable cardinality if no more entity is added.

To extend on the strength from this first pillar, logs is then providing a complementary solution that shines for a more comprehensive observability solution.
Events/Logs: Unraveling the Tapestry of System Behavior
In contrast to metrics, logs share a narrative, offering profound insights into system behavior. Their verbosity renders them ideal for root cause analysis, albeit at the expense of storage costs, dictated by volume and retention duration. Unlike metrics, the quantity of data supersedes cardinality concerns, as each log can be unique and contribute to the context of system behavior without inflating costs.
A combination of metrics and logs is the foundation of an observability architecture capable of traversing both macroscopic trends and microscopic details.
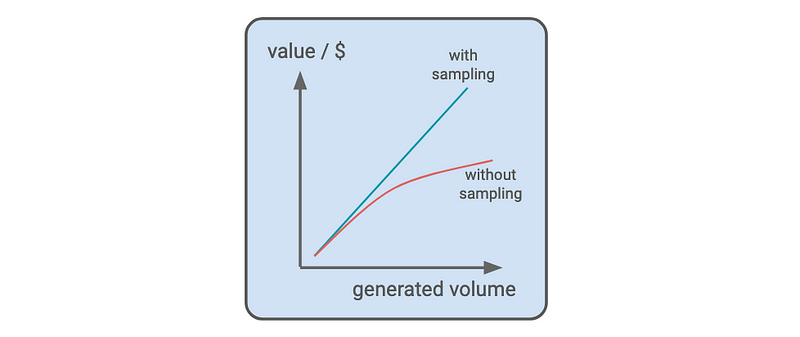
In terms of scalability, as systems grow in usage, the quantity of logs escalates proportionally, leading to escalating volume and costs. This is where lies the first opportunity: while volume raises, the value captured from logs may not scale at the same rate. For instance, receiving 1,000,000 OK logs will provide a similar value as 10,000,000 of OK logs. This is where sampling emerges as a powerful tool, preserving value while mitigating costs. This concept is exemplified by Datadog’s Logging without Limits, where exclusion rules optimize the value for growth ratio.
As an example, when developing on our computer or in a staging environment, developers often want a complete view of all transactions to ensure fast iteration and fast debugging. However, in production with higher volume of transactions, all logs cannot be read and dealt with and sampling becomes mandatory.
This is why, with Datadog Logging without Limits, when systems and services start to scale, users set exclusion rules at 80% or more to keep an eye on any trends without impacting the overall visibility of a system.
As explained earlier, the combination of these initial two pillars presents a robust resource for DevOps teams seeking insights into their systems. Now, when it comes to custom applications, APM emerges as a compelling choice to maximize the benefits offered by both solutions and maximize the value from any observability platform.
APM: The Union of Metrics and Events
Enter APM, a paradigm where metrics converge with traces, offering a whole new toolset for observability. On one side, APM in Datadog includes a complete suite of metrics, recommended in the Google SRE book, such as throughput, latency, error rates for any endpoint, version, environment, etc. On the other side, APM extends its capabilities with traces, unraveling the intricate dependencies within systems and offering infinite cardinality.
For its flexibility and combination of traces as well as metrics, APM is then a core component for applications. A stronger utilization of APM compared to logs or metrics is often an indicator of observability maturity within a team. Not only does it provide long term trends over essential metrics, traces can be enriched with custom business and technical data for more advanced troubleshooting and analytics.
In Datadog, scalability in APM aligns with that of logs, where metrics are incorporated into APM host pricing and traces are governed by volume-based pricing. Nonetheless, a key advantage lies in the inherent sampling feature integrated into all APM solutions, providing default controls over usage growth without compromising value. In such scenarios, APM, akin to logs, applies statistical principles at scale, ensuring that a carefully selected sample size accurately represents the broader behavior of the system.
In Conclusion: Forging a Unified Observability Strategy
In the world of modern observability, metrics, logs, and APM stand as pillars, each offering a unique set of benefits and constraints. The key of a robust observability strategy lies in combining these three pillars to harness their collective strengths while mitigating their individual constraints while connecting each data source. Indeed, as we navigate observability requirements, let us remember that unity and correlation are the key to unlocking true visibility.


![[Youtube] Mastering Synthetic Monitoring with Datadog: A Practical Guide](https://images.unsplash.com/photo-1460925895917-afdab827c52f?crop=entropy&cs=tinysrgb&fit=max&fm=jpg&ixid=M3wxMTc3M3wwfDF8c2VhcmNofDJ8fHdlYnxlbnwwfHx8fDE3NTM4MjMzMjh8MA&ixlib=rb-4.1.0&q=80&w=600)