Monitoring AWS Lambda with Datadog: A Comprehensive Guide

AWS is a leading cloud provider, and one of its key offerings is its serverless computing stack, which allows users to deploy applications without worrying about maintenance. Serverless is particularly cost-efficient for low-scale projects, making it an attractive choice for many businesses.
Datadog provides deep integration with AWS serverless technologies, enabling users to monitor and gain insights into their Lambda functions. This guide walks you through the process of instrumenting an AWS Lambda function using Datadog, from setting up AWS integration to leveraging the Datadog Lambda layer.
What Data Can You Collect?
Datadog captures a broad range of telemetry from AWS Lambda, including metrics, logs, traces, and events. For a detailed list of available metrics, refer to Datadog's AWS Lambda integration documentation. This ensures complete visibility into your serverless deployment. Keep in mind that even though the doc only list the metrics, logs and traces this article will also go the collection of traces and logs.

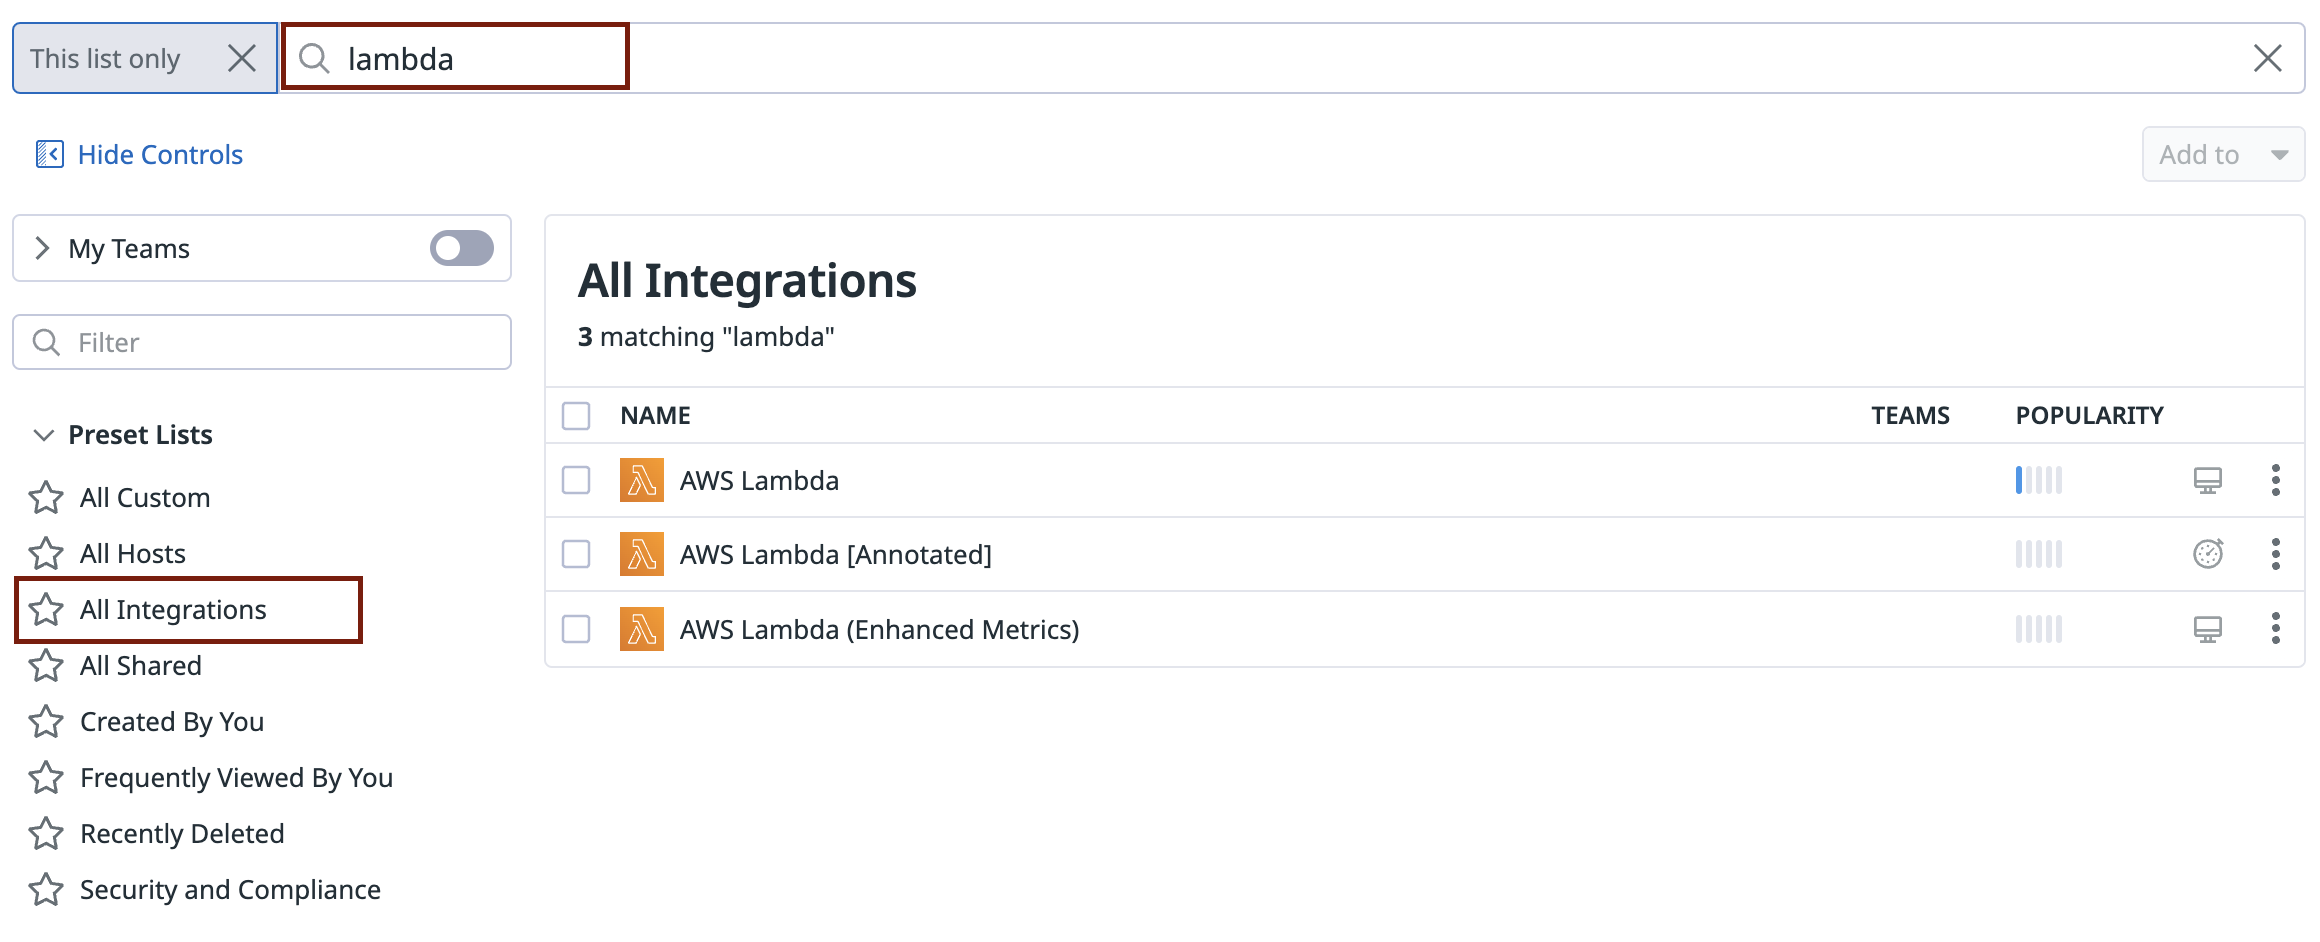
To get started Datadog includes a few default dashboards. Go to your dashboard list, click on all integrations and search for Lambda. Our goal would be to ensure they all include data.
Deploying a Lambda Function
To follow along, you can use this demo repository.
First, setup the variables in variables.tf and terraform.tfvars. (Make sure to copy the example file before cp terraform.tfvars.example terraform.tfvars).
Once done, run
terraform init
terraform apply
This should deploy two Lambda functions and relevant AWS services for them to run properly.
Testing the Deployment
Execute the following commands to ensure both functions are running correctly:
curl -X GET https://<lambda_id>.execute-api.<region>.amazonaws.com/beta/ -v
curl -X GET https://<lambda_id>.execute-api.<region>.amazonaws.com/beta/with-datadog -v
Monitoring with the AWS Integration
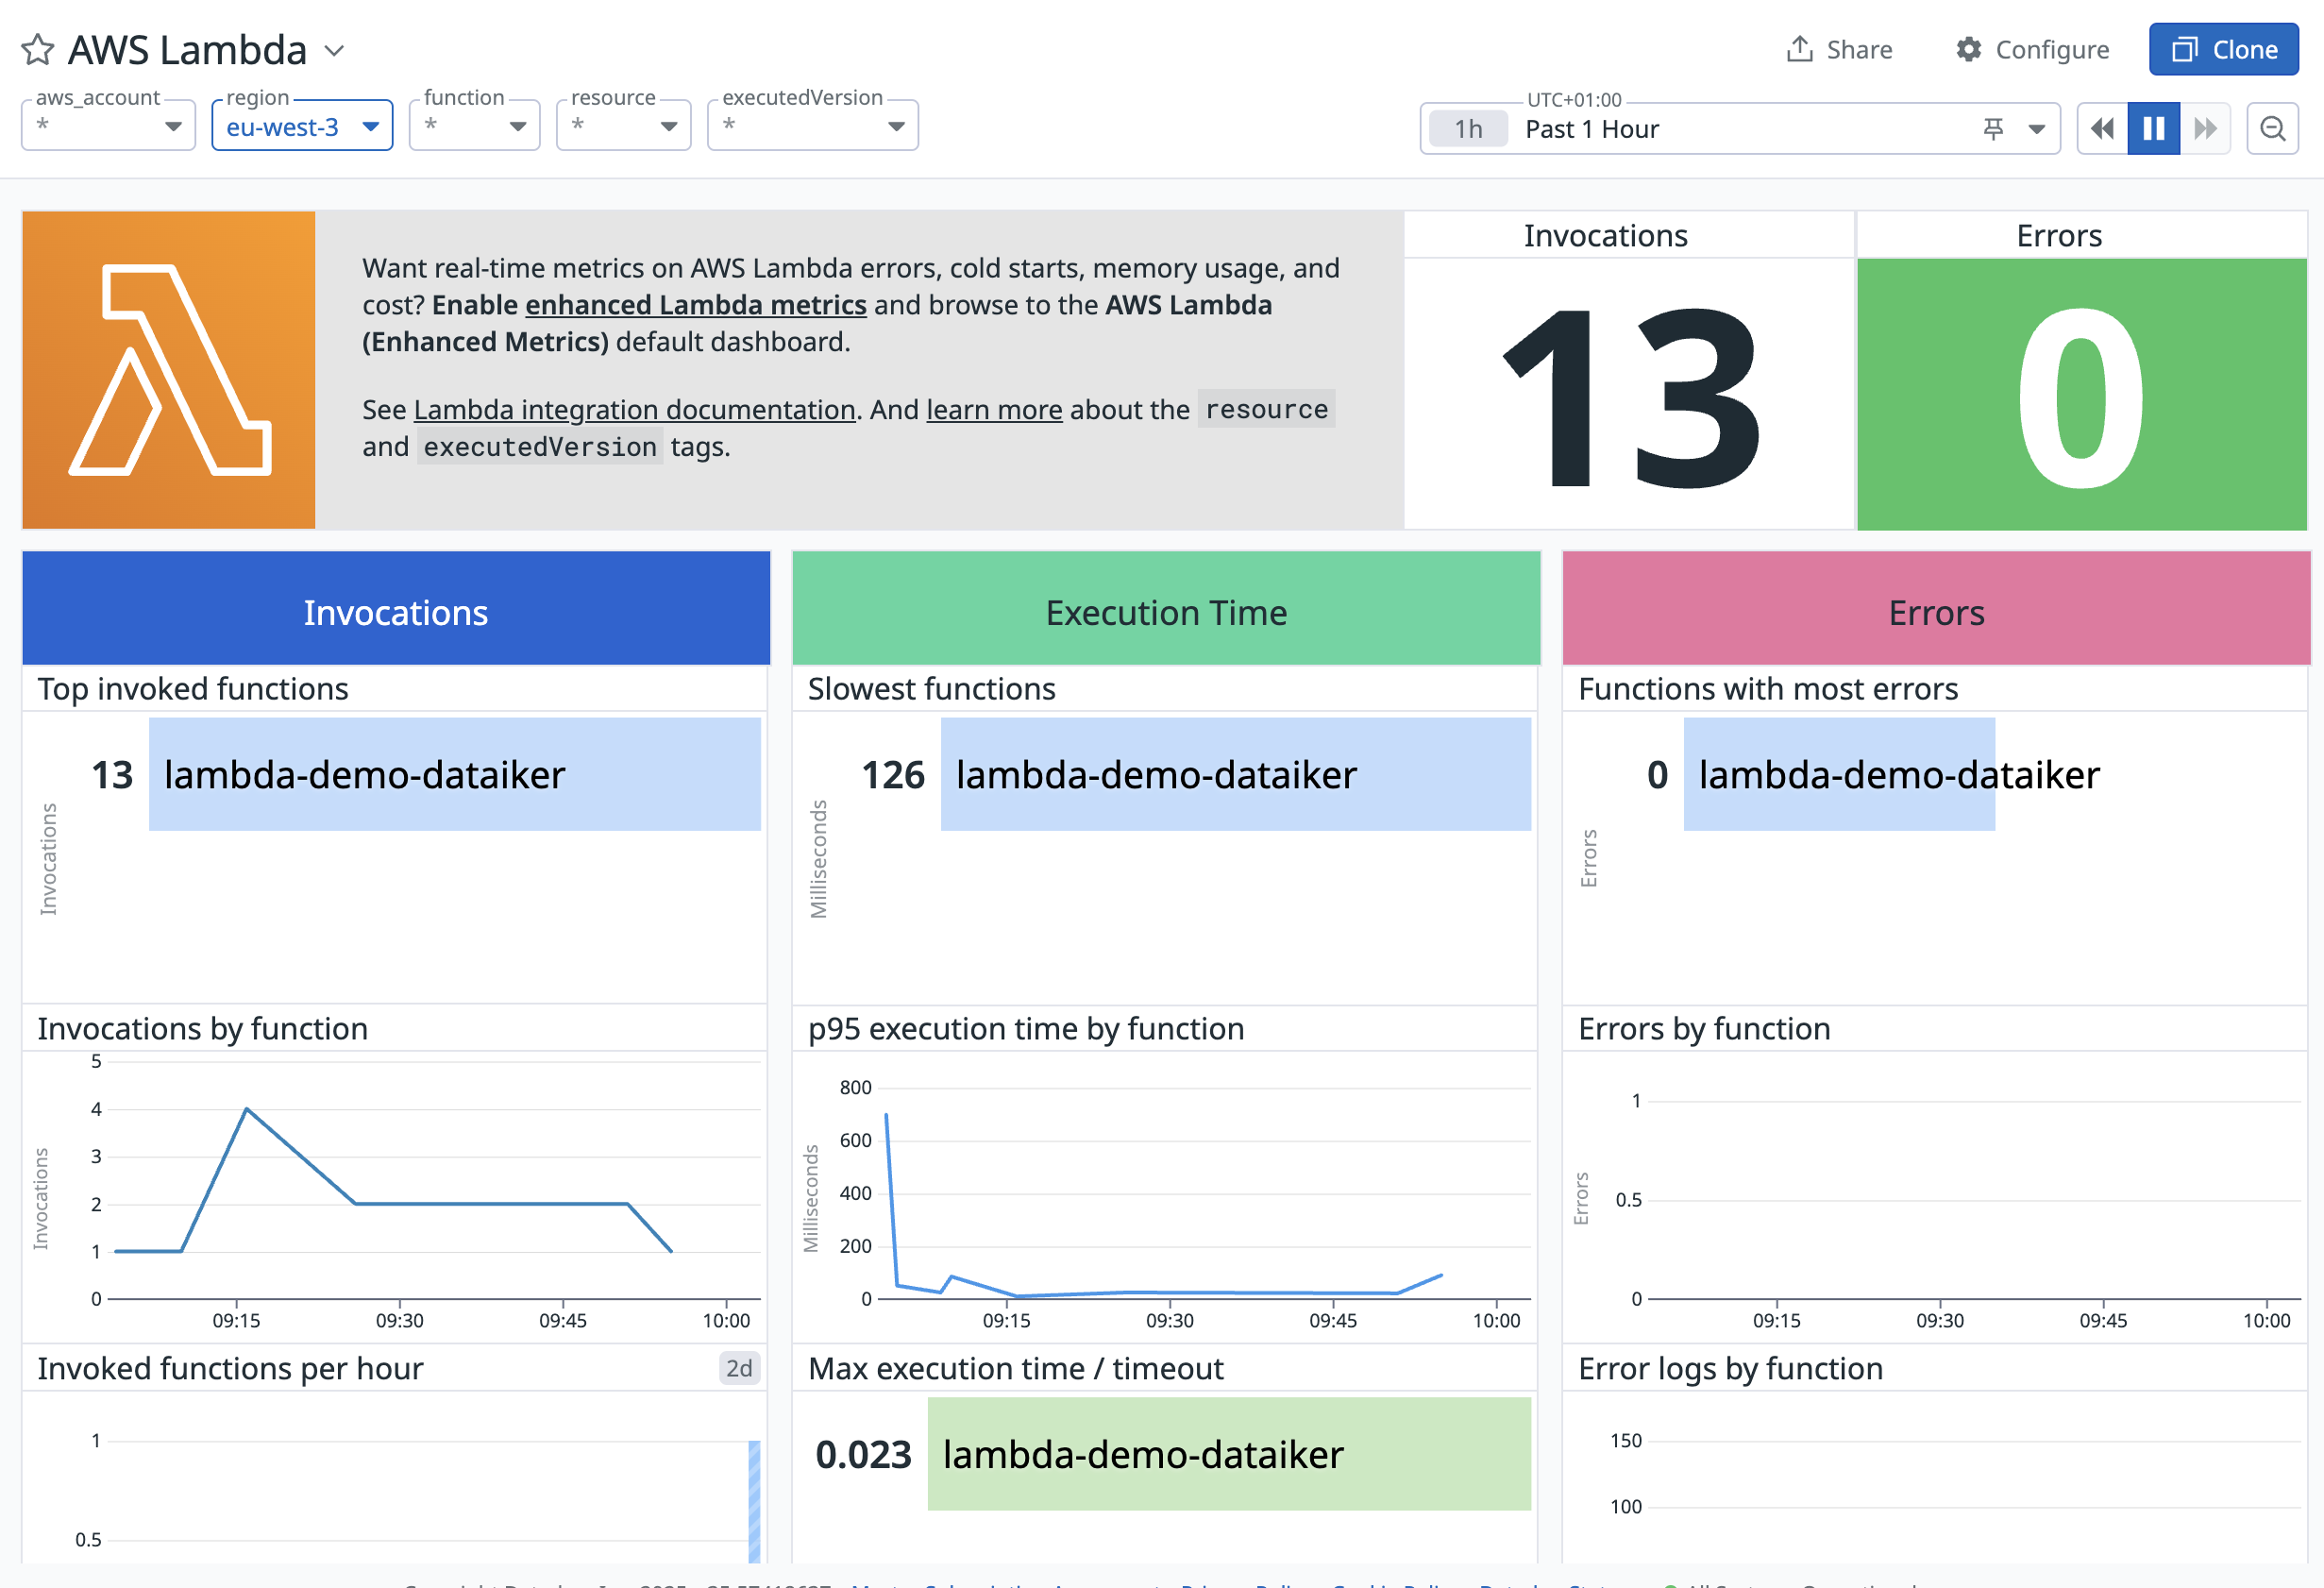
Once your Lambda functions are deployed, Datadog can start collecting data through the AWS integration. For an in-depth setup guide on the AWS Integration, refer to this article. Once done, data should start flowing in. Check the AWS Lambda dashboard for instance.
Troubleshooting Data Collection Issues
If data isn't showing immediately:
- Wait 5 to 15 minutes due to AWS's delay in exposing metrics and the Datadog crawler frequency.
- Check your AWS integration settings:
- Ensure Lambda monitoring is enabled for the correct AWS regions.
- Verify that Lambda functions are tagged appropriately, e.g.,
datadog_monitored:truein our case. - Confirm that service-specific data collection is not restricted on AWS Lambda.
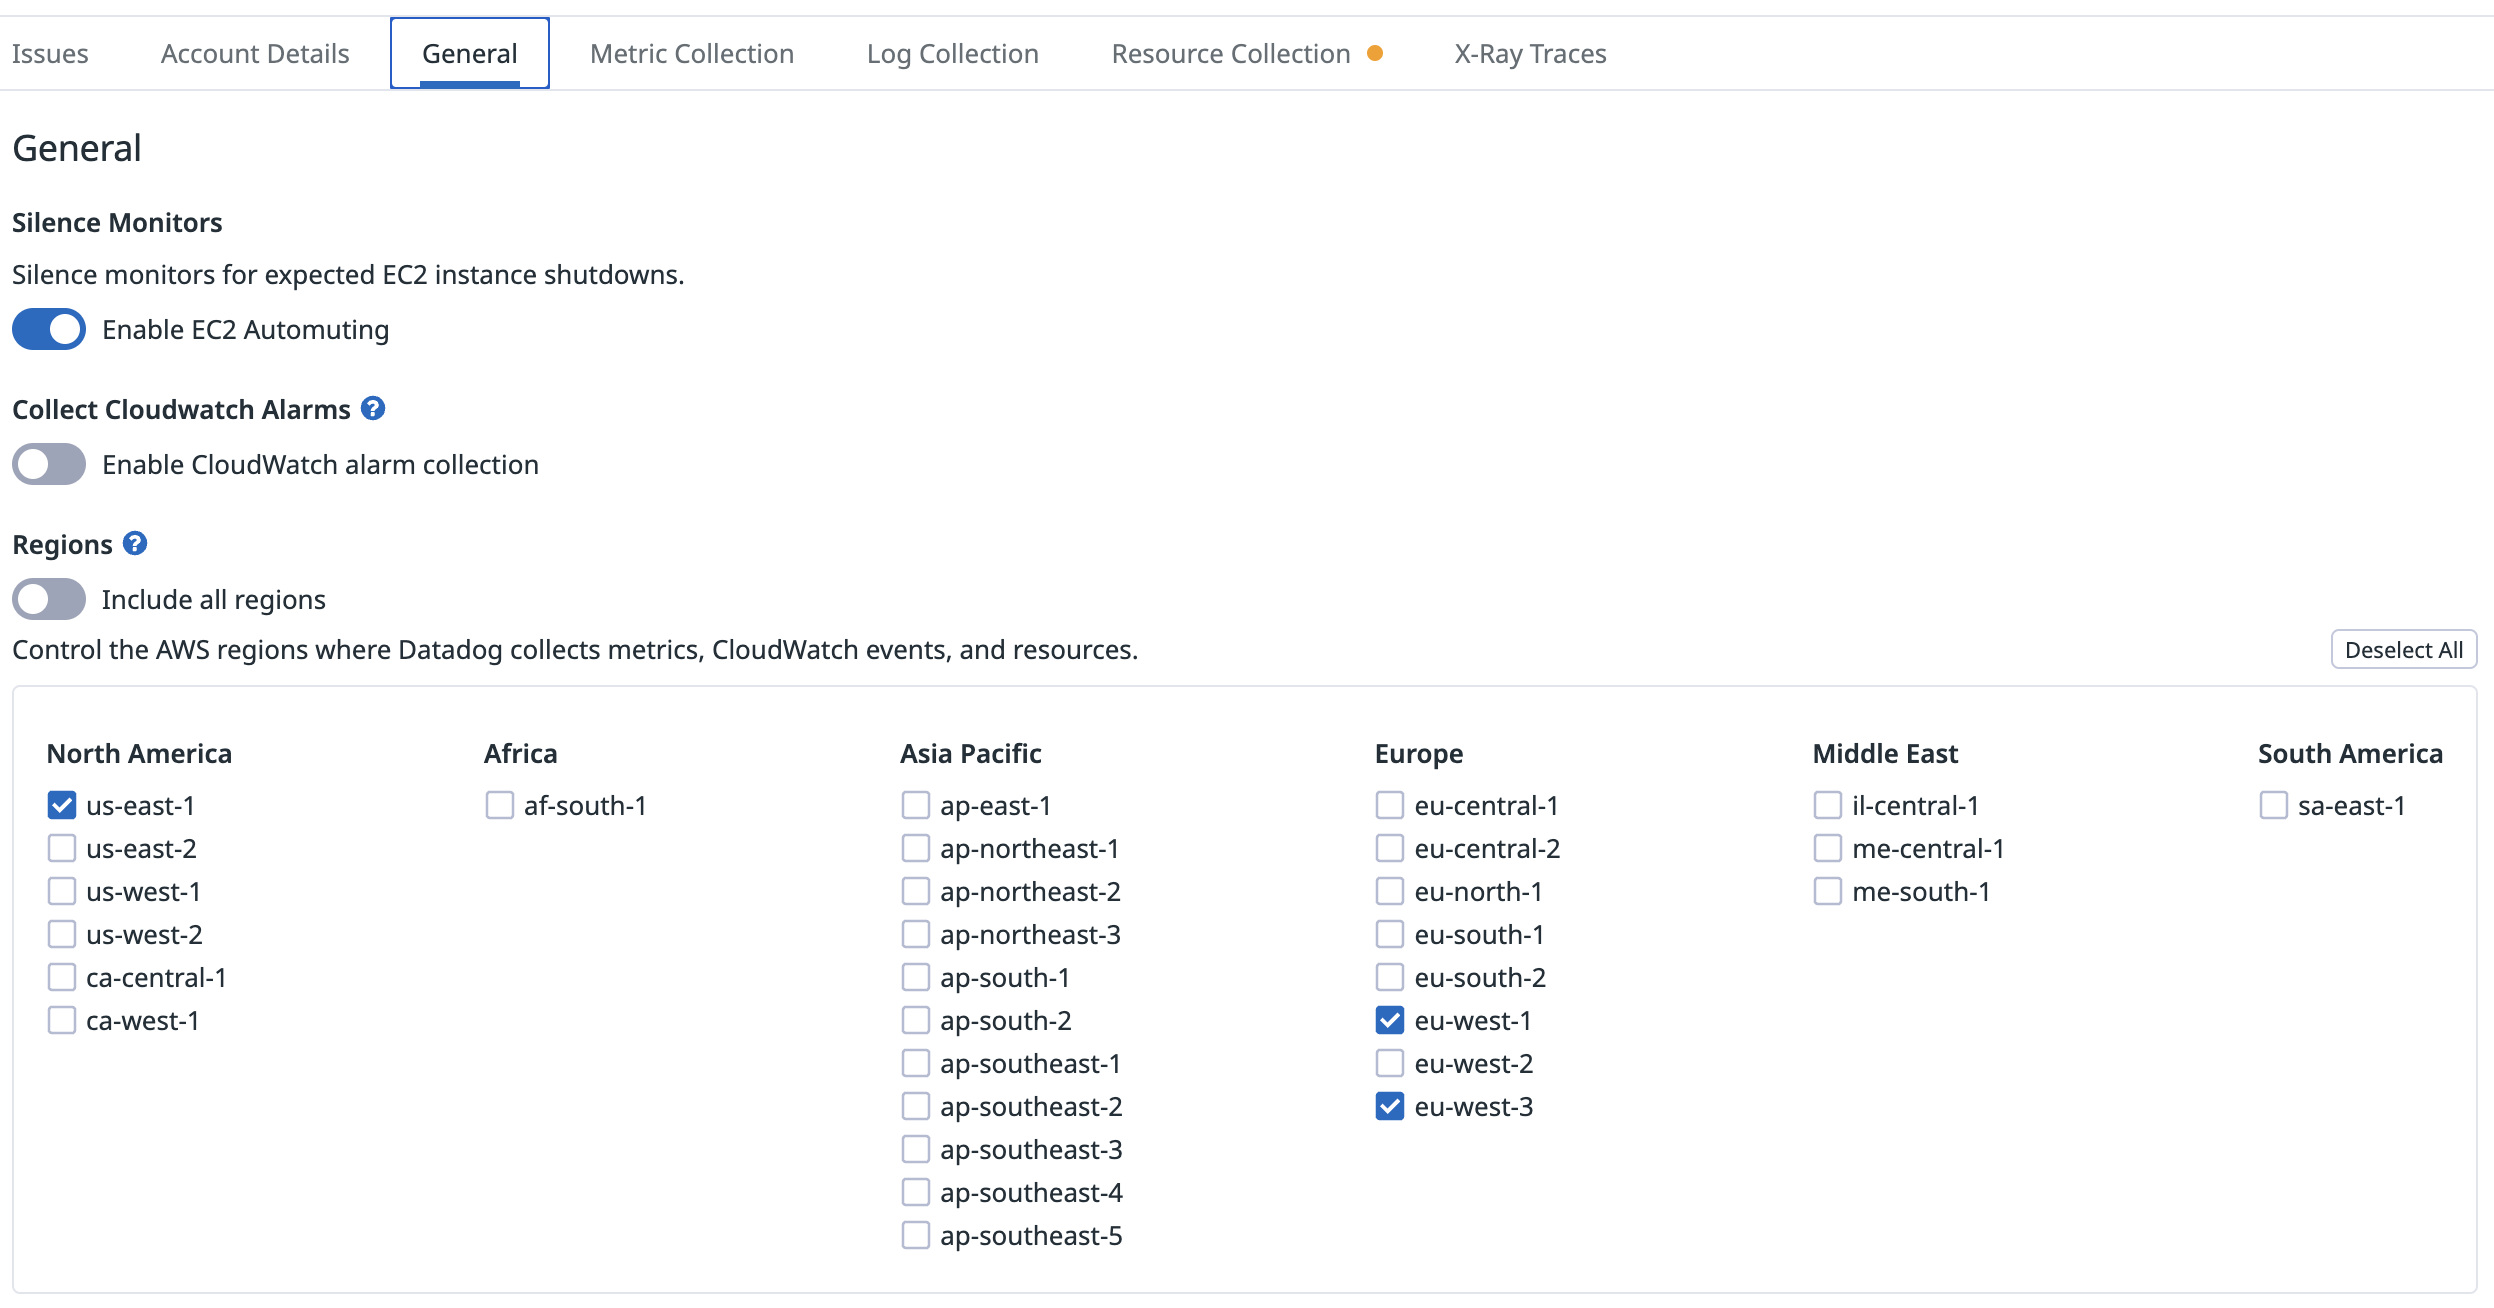
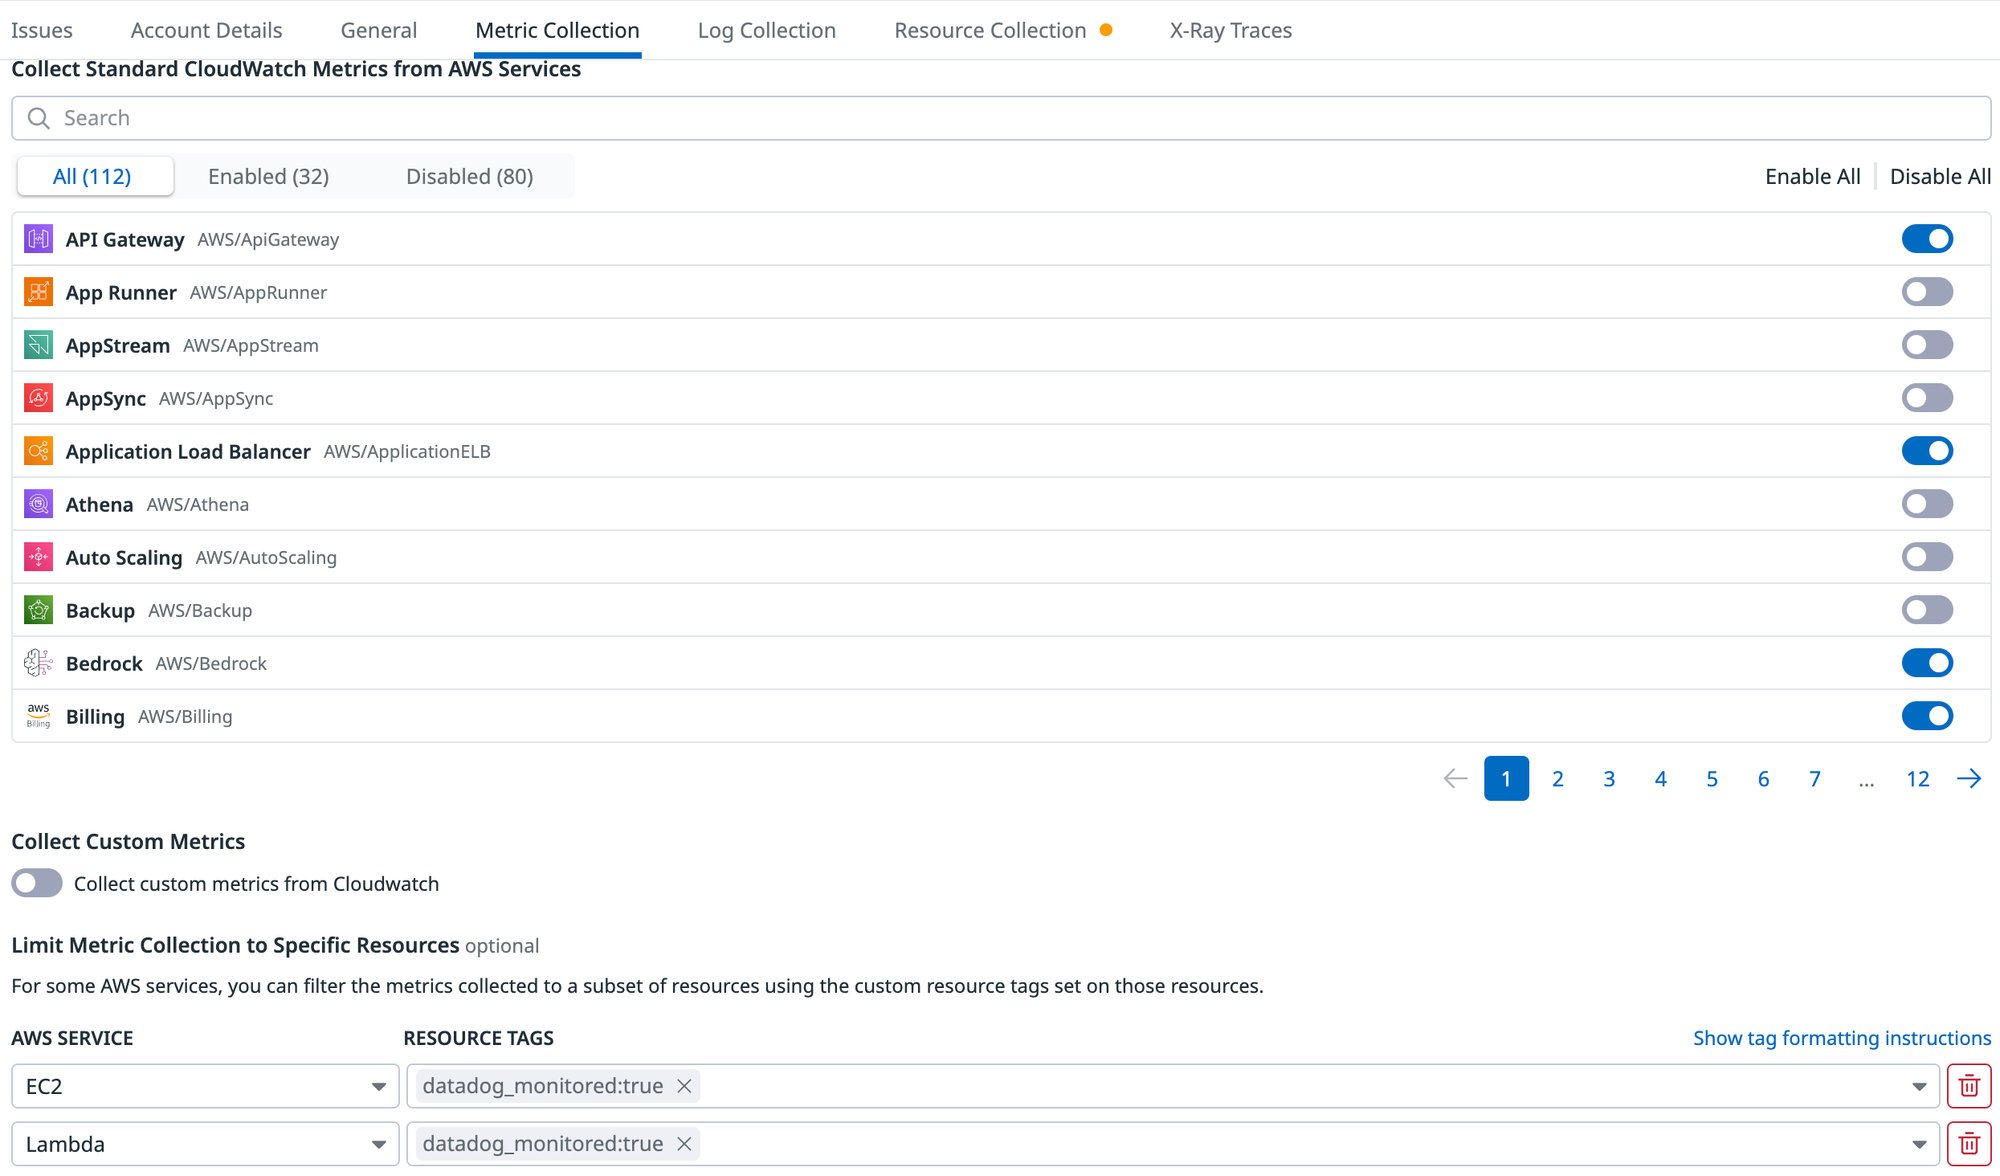
In my case, I deployed in eu-west-3 and I need my lambda to have the tag datadog_monitored:true. Do not hesitate to edit the Terraform files to match you setup.
Visualizing Lambda Data in Datadog
Once data flows into Datadog, the AWS Lambda dashboard provides key insights.
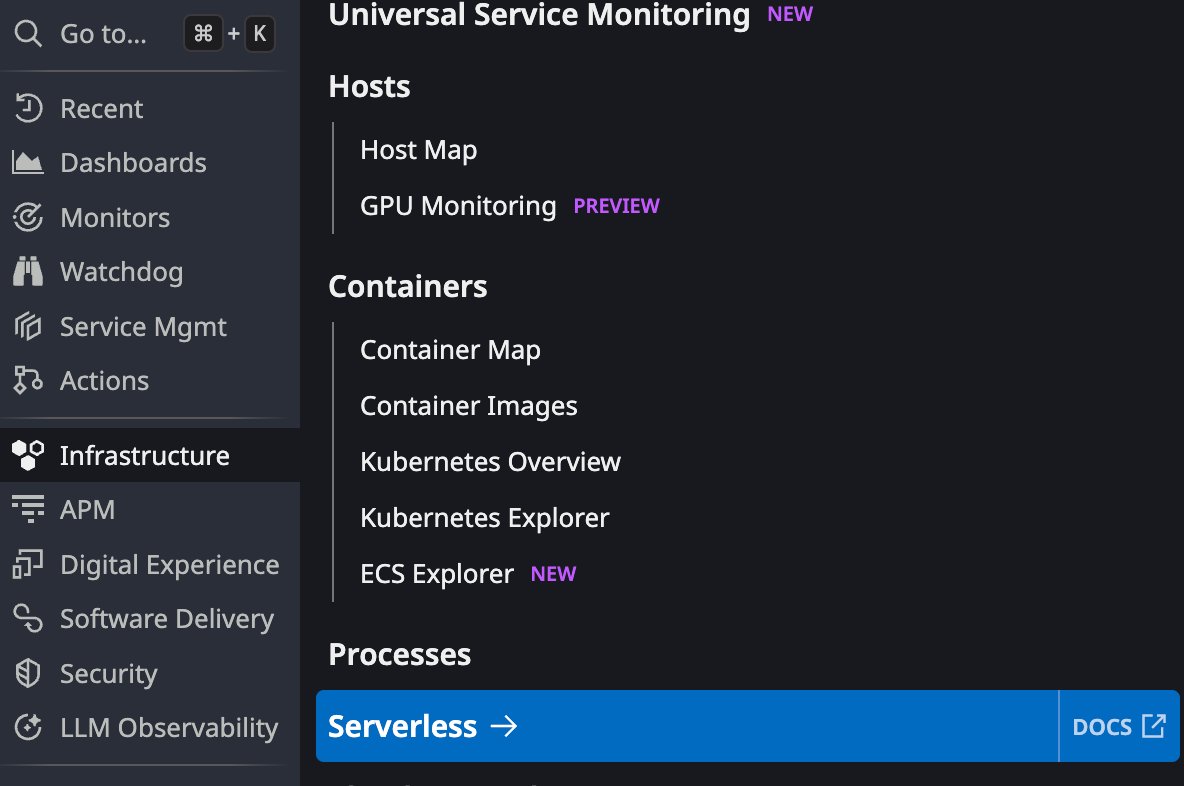
Additionally, Datadog offers a dedicated serverless view:
- Navigate to Infrastructure > Serverless.
- Click on individual invocations for deeper analysis.
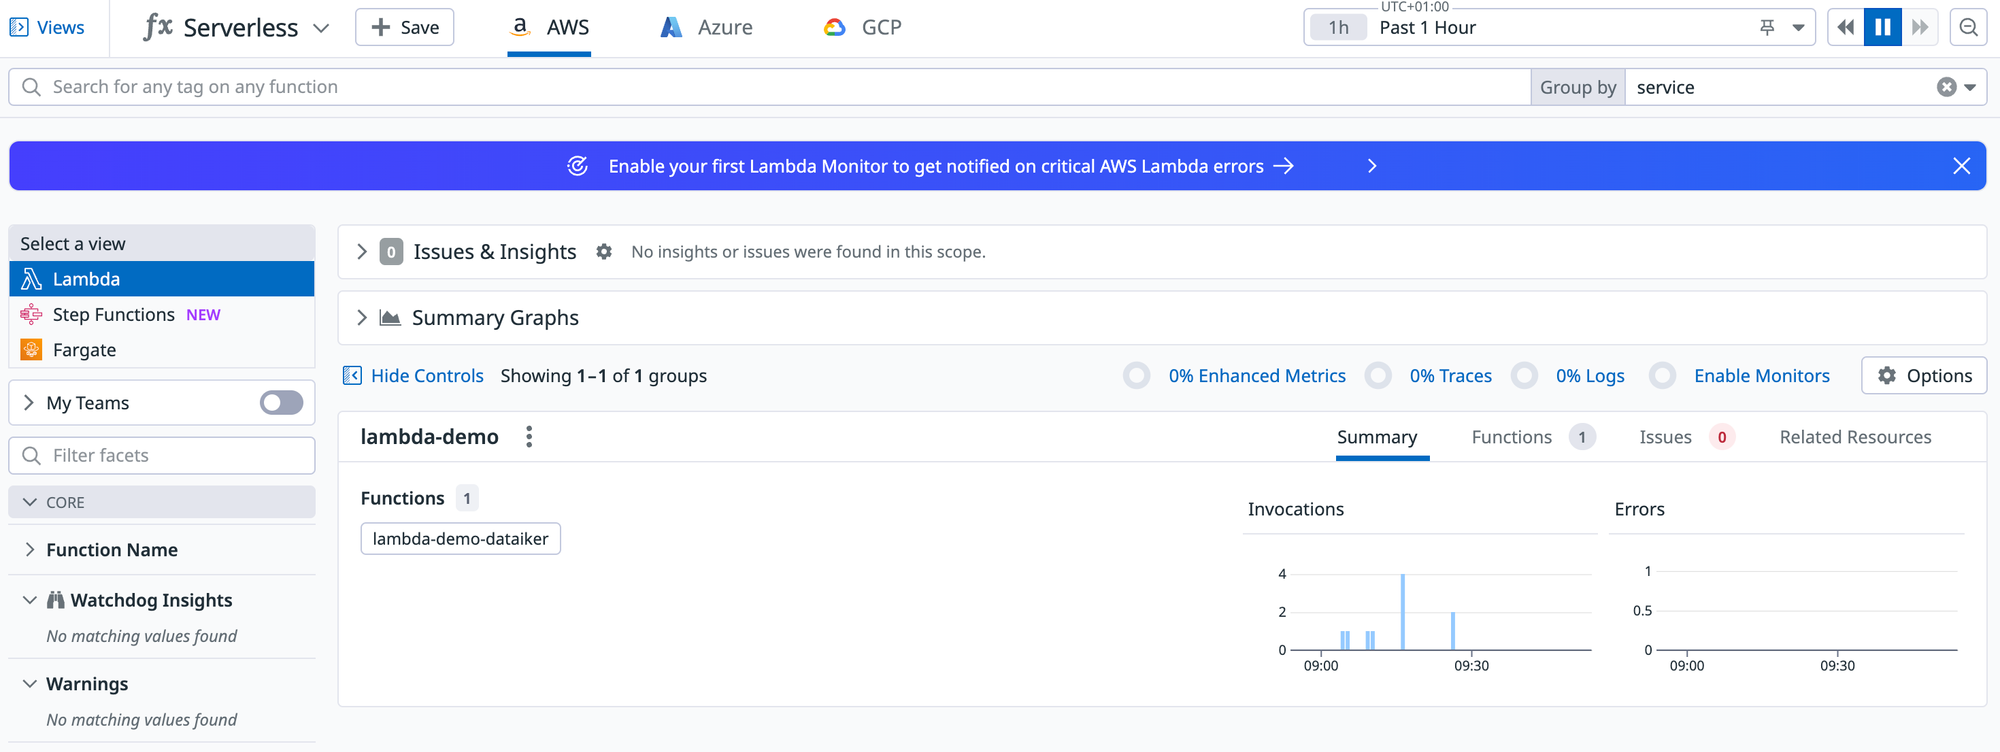
Running your Lambda a few times should populate the dashboard with metrics and traces. If any monitoring gaps exist, such as missing enhanced metrics, traces, or logs, they will be highlighted.
If you look at my screenshot above, I did run one lambda at this time and you can see some KPIs showing missing information:
- 0% enhanced metrics
- 0% traces
- 0% logs
Those metrics give you some kind of insights of you observability coverage. Having the 3 pillars of observability will give you a more comprehensive you of any situation without adding any additional cost to Datadog.
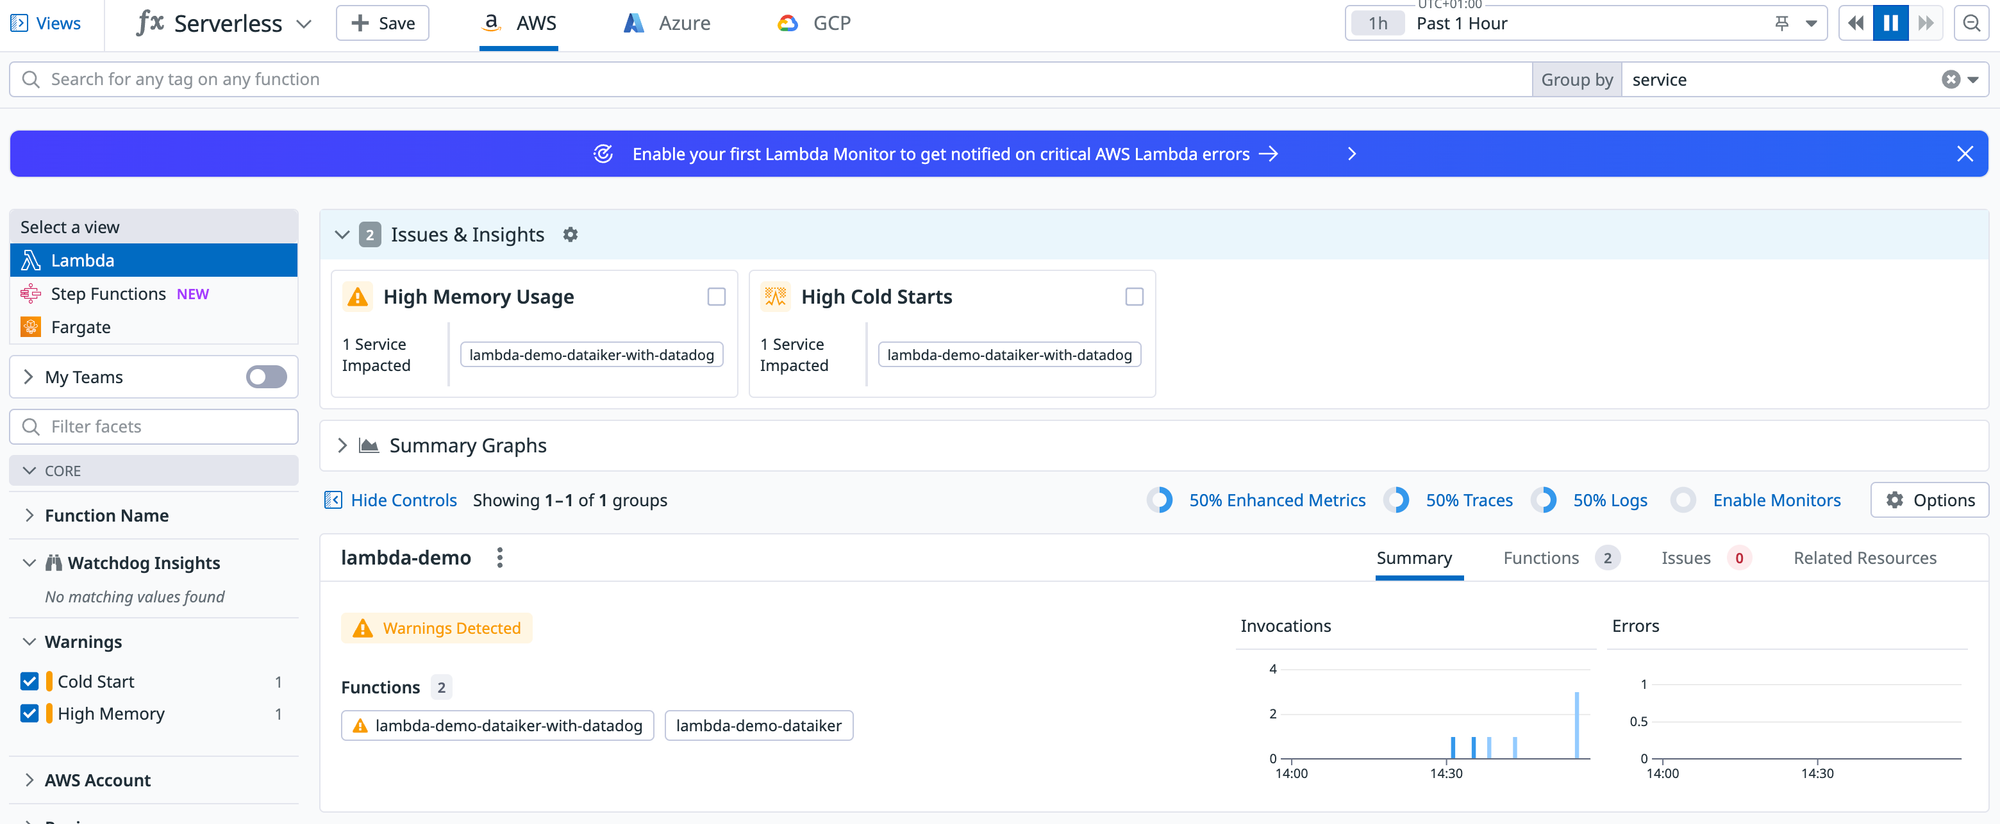
Tagging Tips
As a side note, you may notice that my function here called lambda-demo-dataiker is part of the service called lambda-demo. This is due to the tagging we applied to the lambda itself. We also tagged our lambda with a version number and a environment with the tag env. This helps to organize your lambdas and the overall navigation.
Enhancing Monitoring with Datadog Layers
For full observability, use the Datadog Lambda Layer, which provides real-time enhanced metrics beyond the default AWS integration.
Deploying Datadog Layers with Terraform
Use Datadog's Terraform module for seamless integration:
module "datadog_lambda" {
  source  = "DataDog/terraform-aws-lambda-datadog"
  version = "latest"
}
For more details, visit the Datadog Terraform module repository.
module "lambda-datadog" {
  source  = "DataDog/lambda-datadog/aws"
  version = "2.0.0"

  environment_variables = {
    "DD_API_KEY_SECRET_ARN" : aws_secretsmanager_secret.datadog_api_key_secret.arn
    "DD_ENV" : var.env
    "DD_SERVICE" : var.service
    "DD_SITE": var.datadog_site
    "DD_VERSION" : var.lambda_version
		"ENV_VAR": var.env_var
    "DD_TRACE_OTEL_ENABLED": "false"
    "DD_PROFILING_ENABLED": "false"
    "DD_SERVERLESS_APPSEC_ENABLED": "false"
  }

  datadog_extension_layer_version = 67
  datadog_node_layer_version = 117

  # aws_lambda_function arguments

	function_name = "${var.service}-${var.team}-with-datadog"
  runtime       = "nodejs18.x"  # Adjust according to your Node.js version
  role          = aws_iam_role.lambda_role.arn
  handler       = "index.handler"

  # filename = var.lambda_zip_filepath
	# source_code_hash = filebase64sha256(var.lambda_zip_filepath)
  filename      = "lambda_function_payload.zip"
  source_code_hash = data.archive_file.lambda.output_base64sha256

  timeout       = 30
	memory_size   = 128
  # reserved_concurrent_executions = 3  # Limit to X concurrent executions

  tags = {
    env = var.env
    service = var.service
    team = var.team
    version = var.lambda_version
    datadog_monitored = "true"
  }
}
Lambda Deployment with Datadog Module
 nxnarbais
In our demo app, a lambda is fully instrumented with this layer, lambda-demo-dataiker-with-datadog. To start generating telemetry, run a few times the relevant curl command:
curl -X GET https://<lambda_id>.execute-api.<region>.amazonaws.com/beta/with-datadog -vObserving Additional Metrics
With Datadog Layers enabled, you will see real-time enhanced metrics appearing alongside AWS metrics. These provide deeper insights into:
- Cold start frequency
- Memory usage trends
- Execution bottlenecks
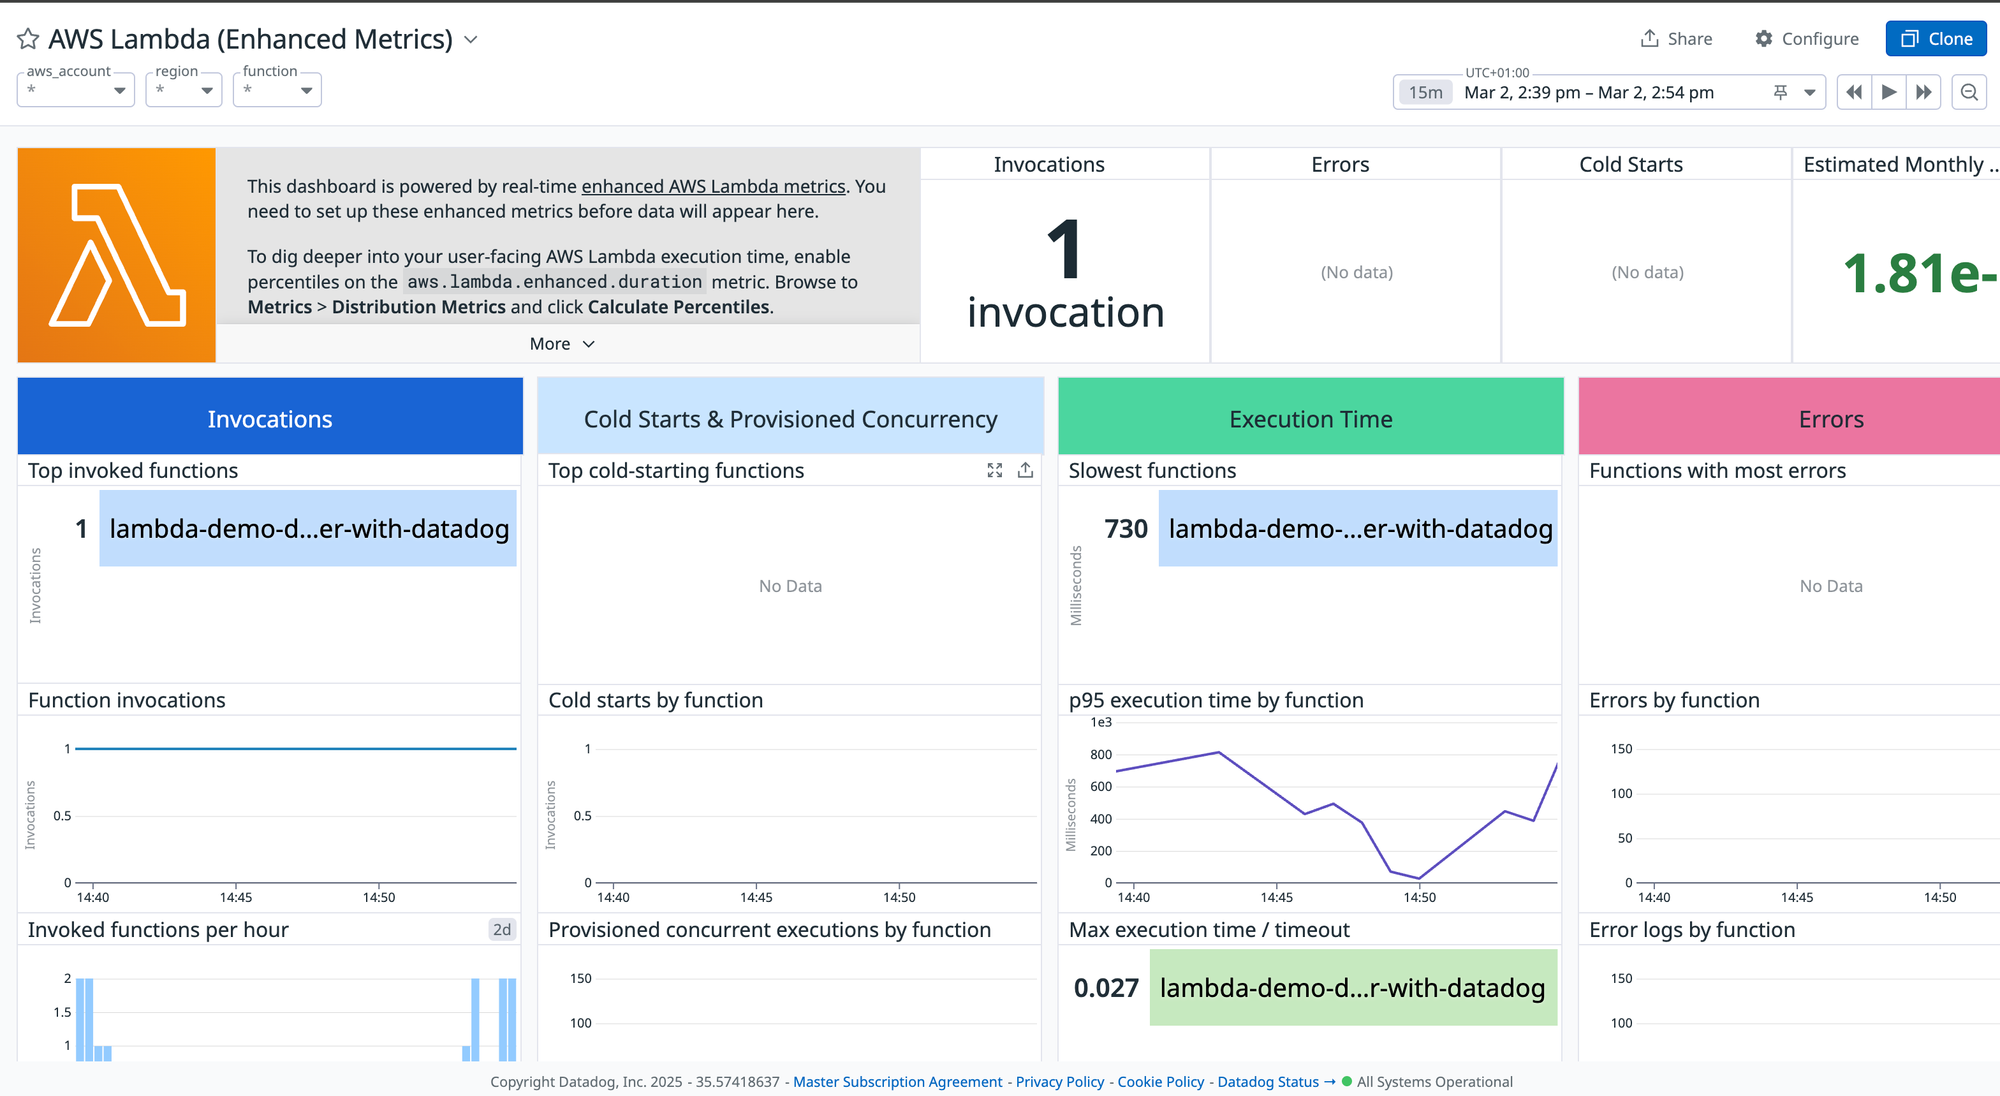
Note: if you were to graph the AWS metrics coming from the AWS integration and the enhanced metrics, you observe that the metrics coming from the Datadog Layer are near real time giving you an improved reaction time.
Advanced Observability: Tracing and Logs
Datadog aggregates multiple data sources, allowing you to:
- View logs, metrics, and traces in a single interface.
- Analyze previous deployments and configurations within the same dashboard.
- Gain full visibility into dependencies (e.g., Lambda functions calling SQS or other AWS services).
In addition, while diving in the lambda-demo-dataiker-with-datadog function, we can start to observe a more comprehensive view.
Below we can start the previous invocations incuding the one with a cold start. A lot of metadata are collected at the top but I also want you to pay attention to the multiple tabs. As always, Datadog principle is to aggregate multiple data source into a single view. With those tabs, easily check your lambda logs, their metrics, the previous deployments and its configuration without leaving the platform. From the invocations tab, the traces are also available to see.
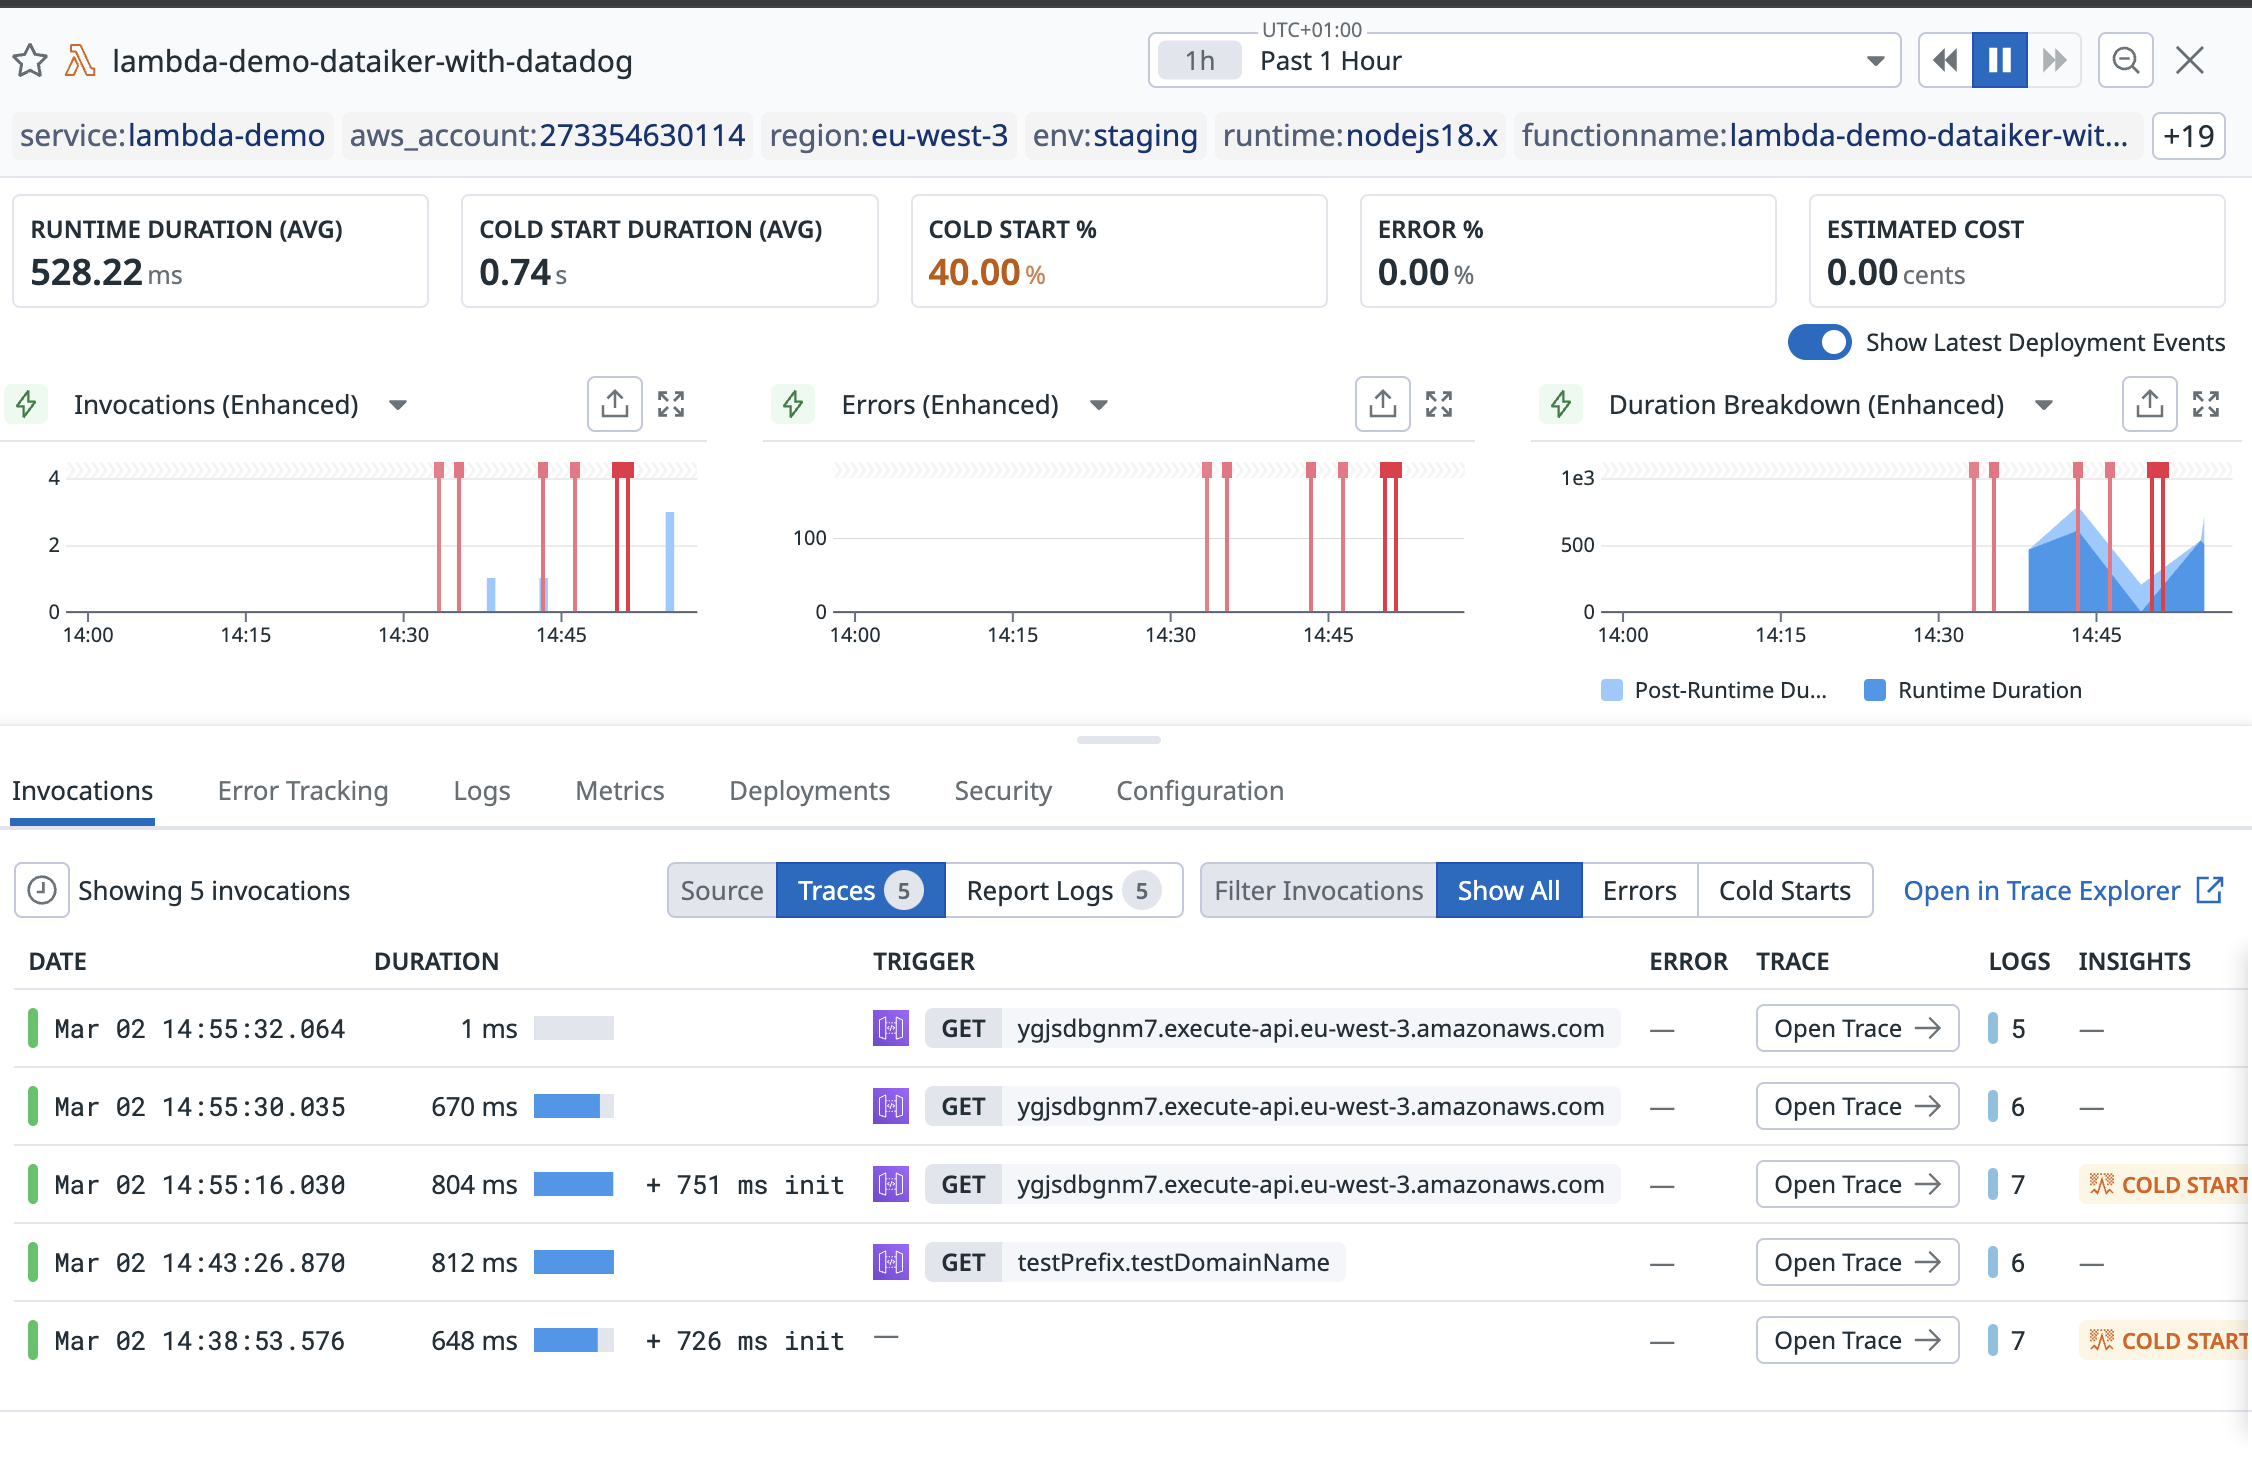

To insist a bit, lambdas are often small functions isolated one from each other but often have dependencies to a lot of other services such as SQS or other lambdas. Having traces setup give you a better understanding of the context of execution and a complete view of what's happening in your serverless architecture.
Troubleshooting with the Datadog CLI
If you encounter issues, use the Datadog CLI to quickly instrument your Lambda functions.
datadog-ci lambda instrument --region <aws-region> --function-name <lambda-name>Conclusion
Instrumenting AWS Lambda with Datadog ensures full observability and enhances performance monitoring. By leveraging Datadog's AWS integration, Lambda Layer, and tracing capabilities, you gain a 360-degree view of your serverless applications.
If you're interested in evaluating your observability maturity, join the discussion at app.dataiker.com.