Making Sense of OpenMetrics in Datadog: Gauges, Counters, and Histograms Demystified

Let’s start with the basics—what exactly is OpenMetrics?
Think of it as the Esperanto of monitoring data: a standardized, plain-text way of exposing metrics so that tools like Datadog can speak the same language across the board. It’s readable by humans and parsable by machines, supporting everything from simple counters to complex histograms.
As OpenMetrics is becoming one of the core standard of observability with adoption from tech like Kubernetes, Datadog has jumped on board too. But here’s a heads-up: if you want to save on custom metric costs in Datadog, stick with native integrations when you can. They count as standard metrics—OpenMetrics ones do not.
Reading OpenMetrics
Now let’s roll up our sleeves and peek inside an OpenMetrics histogram.
# TYPE request_duration_seconds histogram
# HELP request_duration_seconds The duration of HTTP requests
request_duration_seconds_bucket{le="0.1"} 240
request_duration_seconds_bucket{le="0.2"} 450
request_duration_seconds_bucket{le="0.5"} 768
request_duration_seconds_bucket{le="1"} 890
request_duration_seconds_bucket{le="+Inf"} 915
request_duration_seconds_count 915
request_duration_seconds_sum 340.45
It might look like math class at first glance—but hang in there. A line like request_duration_seconds_bucket{le="0.2"} 450 simply means 450 requests took 200 milliseconds or less. So a line like request_duration_seconds_bucket{le="0.1"} 240 means means that 240 requests took 100 milliseconds or less. It’s cumulative, so to find how many took between 100ms and 200ms, you subtract: 450 - 240 = 210. Easy math, big insights.
Now to go further, the {le="+Inf"} is the catch-all bucket: it contains all requests, regardless of duration. The line ending on _count represents the total number of recorded requests and the line ending on _sum represents the sum of all durations. To calculate the average you can then do avg_duration = sum / count = 340.45 / 915 ≈ 0.372s
Histograms shine when you need the full story. Histograms let you:
- Build latency percentiles (e.g. 95th percentile response time).
- Understand distribution, not just averages.
- Detect performance regressions.
Even better? They’re additive across servers and instances. Got 10 instances behind a load balancer? You can sum up how many requests were under 100ms, and it’ll still be accurate. It is a great system to scale your infrastructure and maintain accuracy.
In addition to the above, histograms are extremely useful since we can add their value across instances. Let's say I have my app deployed on 10 servers behind a load balancer, I can add the number of requests below 100ms across all the servers and it will be mathematically correct. This is therefore a great system to scale while keeping accuracy.
They give you distribution—not just averages—so you can build precise percentiles and spot regressions. Even better? They’re additive across servers and instanced. Got 10 instances behind a load balancer? You can sum up how many requests were under 100ms, and it’ll still be accurate.
Summaries, on the other hand? They do not offer aggregation across instances. Since Mathematically adding percentiles does not make sense. Here is an example though:
# HELP http_request_duration_seconds A summary of the HTTP request durations.
# TYPE http_request_duration_seconds summary
http_request_duration_seconds{quantile="0.5"} 0.23
http_request_duration_seconds{quantile="0.9"} 0.45
http_request_duration_seconds{quantile="0.99"} 0.87
http_request_duration_seconds_sum 182.34
http_request_duration_seconds_count 682
OpenMetrics Overal Setup
Getting OpenMetrics up and running with Datadog? Surprisingly painless. The official docs lay things out clearly, and the default config is a breeze.
Edit the conf.d/openmetrics.d/conf.yaml file at the root of your Agent’s configuration directory or in the case of Kubernetes set the right autodiscovery annotations.
Though it might be tempting to reach for the Prometheus integration—because you may be familiar with—I’d actually move towards the OpenMetrics one. The main reason is that it is more popular and includes more features and configuration options.
Our Demo Setup
For our hands-on demo, we’ve got a pretty straightforward playground: a Prometheus container serving metrics on port 9090.
We’re scraping it three times with different configs to understand what’s what. This is just an approach to understand how the configuration impacts what's visible in Datadog while keeping the same data source for comparison.
We limited the scope to just three metric names to keep our custom metric bill from ballooning. (Pro tip: resist the temptation to go full regex with .+—unless all metrics are important but often enough you have some unnecessary metrics that just increase your costs.)
---
apiVersion: v1
kind: ConfigMap
metadata:
  name: prometheus-config
data:
  prometheus.yaml: |
    # Paste the full contents of your prometheus.yaml file here
    global:
      scrape_interval:     15s
      evaluation_interval: 15s

    rule_files:
      # - "first.rules"
      # - "second.rules"

    scrape_configs:
      - job_name: prometheus
        static_configs:
          - targets: ['localhost:9090']
---
apiVersion: apps/v1
kind: Deployment
metadata:
  name: dd-prometheus
  labels:
    app: dd-prometheus
spec:
  replicas: 1
  selector:
    matchLabels:
      app: dd-prometheus
  template:
    metadata:
      labels:
        app: dd-prometheus
      annotations:
        ad.datadoghq.com/prometheus.checks: |
          {
            "openmetrics": {
              "init_config": {},
              "instances": [
                {
                  "openmetrics_endpoint": "http://%%host%%:9090/metrics",
                  "namespace": "hist_",
                  "metrics": ["go_gc_heap_frees_by_size_bytes","prometheus_http_requests", "prometheus_target_metadata_cache_bytes"],
                  "collect_histogram_buckets": true,
                  "non_cumulative_histogram_buckets": false,
                  "histogram_buckets_as_distributions": false,
                  "collect_counters_with_distributions": false
                },
                {
                  "openmetrics_endpoint": "http://%%host%%:9090/metrics",
                  "namespace": "histnc_",
                  "metrics": ["go_gc_heap_frees_by_size_bytes","prometheus_http_requests", "prometheus_target_metadata_cache_bytes"],
                  "collect_histogram_buckets": true,
                  "non_cumulative_histogram_buckets": true,
                  "histogram_buckets_as_distributions": false,
                  "collect_counters_with_distributions": false
                },
                {
                  "openmetrics_endpoint": "http://%%host%%:9090/metrics",
                  "namespace": "distrib_",
                  "metrics": ["go_gc_heap_frees_by_size_bytes","prometheus_http_requests", "prometheus_target_metadata_cache_bytes"],
                  "collect_histogram_buckets": true,
                  "non_cumulative_histogram_buckets": true,
                  "histogram_buckets_as_distributions": true,
                  "collect_counters_with_distributions": true
                }
              ]
            }
          }
    spec:
      containers:
        - name: prometheus
          image: prom/prometheus
          ports:
            - containerPort: 9090
          volumeMounts:
            - name: config-volume
              mountPath: /etc/prometheus/prometheus.yaml
              subPath: prometheus.yaml
      volumes:
        - name: config-volume
          configMap:
            name: prometheus-config
---
apiVersion: v1
kind: Service
metadata:
  name: dd-prometheus
  labels:
    app: dd-prometheus
spec:
  selector:
    app: dd-prometheus
  type: LoadBalancer
  ports:
    - protocol: TCP
      port: 9090
      targetPort: 9090
      nodePort: 30123
Visualizing OpenMetrics Gauges
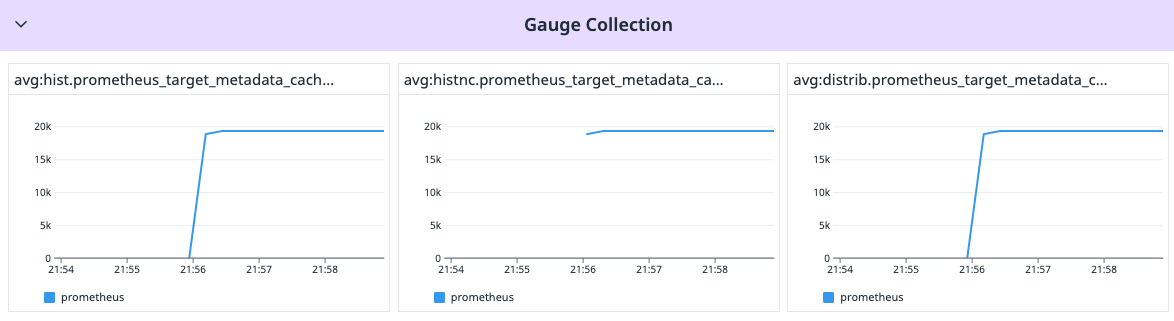
Let’s talk gauges. They’re the easiest to understand here. In our setup, no matter the configuration, they are all behaving the same way.
Take prometheus_target_metadata_cache_bytes: it tells you how much cache your metadata is hogging.
# HELP prometheus_target_metadata_cache_bytes The number of bytes that are currently used for storing metric metadata in the cache
# TYPE prometheus_target_metadata_cache_bytes gauge
prometheus_target_metadata_cache_bytes{scrape_job="prometheus"} 19294
To visualize such metric, you could use such metric query in Datadog:
avg:hist.prometheus_target_metadata_cache_bytes{*} by {scrape_job}
avg:histnc.prometheus_target_metadata_cache_bytes{*} by {scrape_job}
avg:distrib.prometheus_target_metadata_cache_bytes{*} by {scrape_job}
The results of those queries can be seen below and we can properly see a similar result.
Visualizing OpenMetrics Counters
Counters are like the step-counters on your phone—always going up. And in this case, no matter how you configure them, the final tally remains the same.
Look at prometheus_http_requests_total: it logs each HTTP request and simply increment the counter for each individual handler and code.
# HELP prometheus_http_requests_total Counter of HTTP requests.
# TYPE prometheus_http_requests_total counter
prometheus_http_requests_total{code="200",handler="/"} 0
prometheus_http_requests_total{code="200",handler="/-/healthy"} 0
prometheus_http_requests_total{code="200",handler="/-/quit"} 0
prometheus_http_requests_total{code="200",handler="/-/ready"} 0
prometheus_http_requests_total{code="200",handler="/-/reload"} 0
...
prometheus_http_requests_total{code="200",handler="/classic/static/*filepath"} 0
prometheus_http_requests_total{code="200",handler="/config"} 0
prometheus_http_requests_total{code="200",handler="/consoles/*filepath"} 0
prometheus_http_requests_total{code="200",handler="/debug/*subpath"} 0
prometheus_http_requests_total{code="200",handler="/favicon.ico"} 0
prometheus_http_requests_total{code="200",handler="/favicon.svg"} 0
prometheus_http_requests_total{code="200",handler="/federate"} 0
prometheus_http_requests_total{code="200",handler="/flags"} 0
prometheus_http_requests_total{code="200",handler="/graph"} 0
prometheus_http_requests_total{code="200",handler="/manifest.json"} 0
prometheus_http_requests_total{code="200",handler="/metrics"} 136
prometheus_http_requests_total{code="200",handler="/query"} 0
prometheus_http_requests_total{code="200",handler="/rules"} 0
prometheus_http_requests_total{code="200",handler="/service-discovery"} 0
prometheus_http_requests_total{code="200",handler="/status"} 0
prometheus_http_requests_total{code="200",handler="/targets"} 0
prometheus_http_requests_total{code="200",handler="/tsdb-status"} 0
prometheus_http_requests_total{code="200",handler="/version"} 0
Even though different configurations might offer slightly different granularity, the overall count is consistent.
To visualize them in Datadog, you can use the queries below.
sum:hist.prometheus_http_requests.count{*} by {handler,code}.as_count()
sum:histnc.prometheus_http_requests.count{*} by {handler,code}.as_count()
sum:distrib.prometheus_http_requests.count{*} by {handler,code}.as_count()
This will provide such result where each color represent a different combination of handler and code.
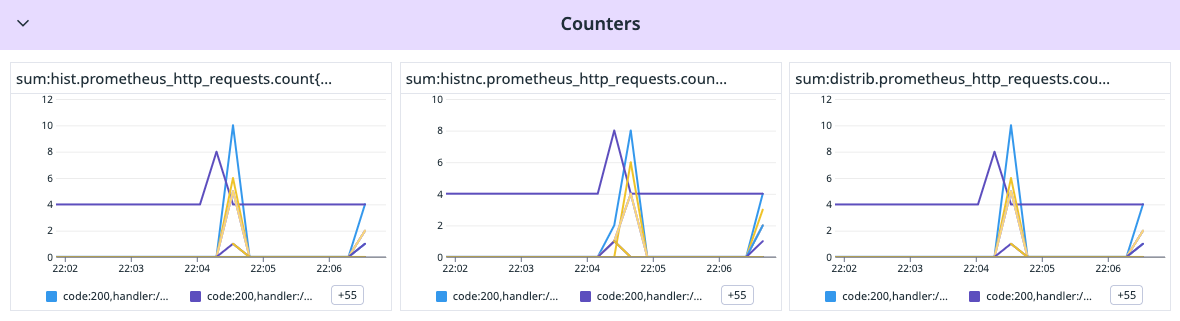
Now one of the main difference between OpenMetrics and Datadog, OpenMetrics is a counter that keeps going up except on restart while Datadog only display the increment in between two data points. This is often easier to read than having a counter at 150354 and figuring out from the previous value how much it increased.
However, if over a period of time, you are looking to get the overall count, you can use the cumsum function in Datadog.
Visualizing Histograms in Datadog
Ah, histograms in Datadog. Here is where things are getting interesting and spicy.
Let's see an example first:
# HELP go_gc_heap_frees_by_size_bytes Distribution of freed heap allocations by approximate size. Bucket counts increase monotonically. Note that this does not include tiny objects as defined by /gc/heap/tiny/allocs:objects, only tiny blocks. Sourced from /gc/heap/frees-by-size:bytes.
# TYPE go_gc_heap_frees_by_size_bytes histogram
go_gc_heap_frees_by_size_bytes_bucket{le="8.999999999999998"} 48961
go_gc_heap_frees_by_size_bytes_bucket{le="24.999999999999996"} 275228
go_gc_heap_frees_by_size_bytes_bucket{le="64.99999999999999"} 396122
go_gc_heap_frees_by_size_bytes_bucket{le="144.99999999999997"} 523261
go_gc_heap_frees_by_size_bytes_bucket{le="320.99999999999994"} 531850
go_gc_heap_frees_by_size_bytes_bucket{le="704.9999999999999"} 534178
go_gc_heap_frees_by_size_bytes_bucket{le="1536.9999999999998"} 535561
go_gc_heap_frees_by_size_bytes_bucket{le="3200.9999999999995"} 536694
go_gc_heap_frees_by_size_bytes_bucket{le="6528.999999999999"} 537860
go_gc_heap_frees_by_size_bytes_bucket{le="13568.999999999998"} 538293
go_gc_heap_frees_by_size_bytes_bucket{le="27264.999999999996"} 538559
go_gc_heap_frees_by_size_bytes_bucket{le="+Inf"} 538619
go_gc_heap_frees_by_size_bytes_sum 5.5454224e+07
go_gc_heap_frees_by_size_bytes_count 538619
As before, to visualize those numbers let's use the queries below. As you can see, I used a cumsum function. This is more for this demo to find the value matching the actual OpenMetrics output.
For the tables, we will use those queries:
sum:hist.go_gc_heap_frees_by_size_bytes.bucket{*} by {upper_bound}.as_count()
sum:histnc.go_gc_heap_frees_by_size_bytes.bucket{*} by {upper_bound,lower_bound}.as_count()
count:distrib.go_gc_heap_frees_by_size_bytes{*} by {upper_bound,lower_bound}.as_count()
For the timeseries, those are the queries used:
cumsum(sum:hist.go_gc_heap_frees_by_size_bytes.bucket{*} by {upper_bound}.as_count())
cumsum(sum:histnc.go_gc_heap_frees_by_size_bytes.bucket{*} by {upper_bound,lower_bound}.as_count())
cumsum(count:distrib.go_gc_heap_frees_by_size_bytes{*} by {upper_bound,lower_bound}.as_count())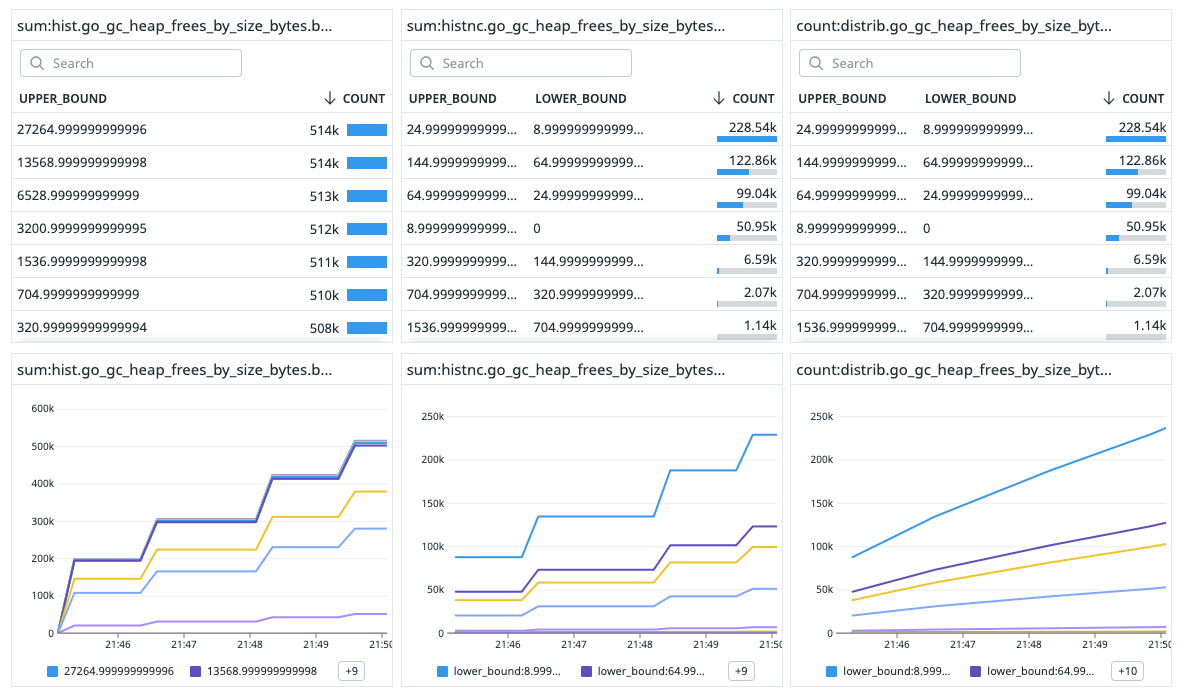
Let's review our different configuration options below:
## Option 1
{
  "openmetrics_endpoint": "http://%%host%%:9090/metrics",
  "namespace": "hist_",
  "metrics": ["go_gc_heap_frees_by_size_bytes","prometheus_http_requests", "prometheus_target_metadata_cache_bytes"],
  "collect_histogram_buckets": true,
  "non_cumulative_histogram_buckets": false,
  "histogram_buckets_as_distributions": false,
  "collect_counters_with_distributions": false
},
## Option 2
{
  "openmetrics_endpoint": "http://%%host%%:9090/metrics",
  "namespace": "histnc_",
  "metrics": ["go_gc_heap_frees_by_size_bytes","prometheus_http_requests", "prometheus_target_metadata_cache_bytes"],
  "collect_histogram_buckets": true,
  "non_cumulative_histogram_buckets": true,
  "histogram_buckets_as_distributions": false,
  "collect_counters_with_distributions": false
},
## Option 3
{
  "openmetrics_endpoint": "http://%%host%%:9090/metrics",
  "namespace": "distrib_",
  "metrics": ["go_gc_heap_frees_by_size_bytes","prometheus_http_requests", "prometheus_target_metadata_cache_bytes"],
  "collect_histogram_buckets": true,
  "non_cumulative_histogram_buckets": true,
  "histogram_buckets_as_distributions": true,
  "collect_counters_with_distributions": true
}
Option 1 keeps things raw. It can be seen in the left column of the screenshot. The values are matching what we see in the raw OpenMetrics output. For each upper_bound, it will display the total amount of times the go_gc_heap_frees is below the given value.
This also means that if upper_bound is not selected, Datadog will perform a spatial aggregation across all upper_bound, the value then provided is meaningless since we would count multiple times each go_gc_heap_frees measurement.
This first option is ideal if you already very familiar with histograms and do not want to change. Make sure you select an upper_bound tag always.
Option 2 goes modern with non-cumulative buckets. It gives you individual slices of each "band" instead of the whole count below an upper value. In our screenshot, this is what can be seen in the middle column with an upper_bound and lower_bound for each row.
This time, it means that if no upper_bound is selected, the final value would be the total number of measures taken which is still relevant.
It is now easier to spot which “band” is increasing and what to do from there. Whereas on the first option, all the upper_bound values need to be observed to identify which "band" is the largest, in this second option, the largest band is clearly displayed at the top of the table for instance.
However, one of the limitation of such visualization is that an increase of the "band" 0 to 8.99 is great whereas an increase of the "band" 704.99 to 1536.99 may not be as good. It is then therefore still a bit complex to read this graph in a few seconds.
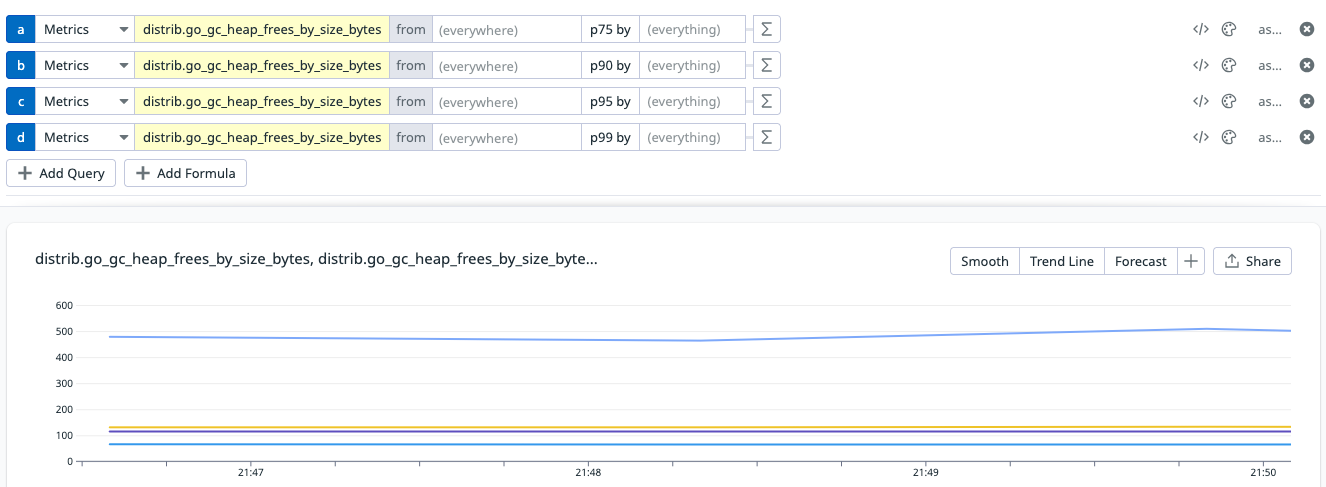
Option 3 is the luxury package. Except the query that is different, the value displayed are relatively similar to option 2. However, the power of such solution lies in the fact that the metric are collected as distribution. Distributions unlock percentiles, which are pure gold for metrics like latency. Instead of squinting at bars, you get crisp values like “p95 = 300ms.” Fast to read, fast to act.
To enable the percentile, go to metric summary and enable percentiles in the advanced section.
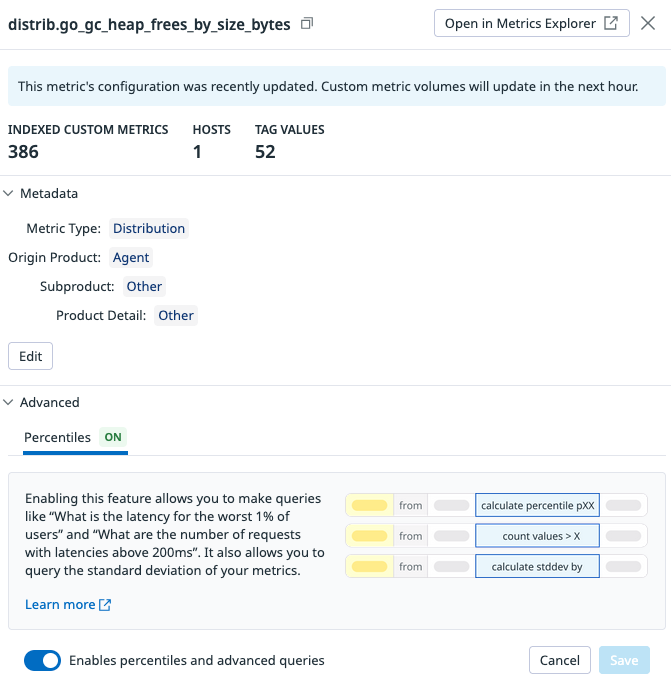
What this means is from that point on any percentile is then available. As mentioned before, percentiles are a lot easier to read since for instance for a latency metric, any increase is seen as negative. No need to understand the "band" used.
And this is the result, at a glance, we can observe our pXX of the go_gc_heap_frees which makes it easier to monitor but also to add markers on the graph for an instant understanding of the state of the metric.
Histogram Configuration Option Conclusion
Here’s the TL;DR on which histogram config to choose:
- Option 1: Stick with this if you’re a histogram veteran. It’s familiar and reliable—just don’t forget that
upper_bound! - Option 2: Great for saving on custom metrics while gaining better visual clarity. It highlights bands cleanly and will be less error prone.
- Option 3: Best for high-stakes metrics. Percentiles are your secret weapon for fast decision-making. If it’s a dashboard you’ll check at 3 AM, this is the one to trust.
OpenMetrics Further Configuration
A few extra tricks to get the most out of OpenMetrics with Datadog. For all the options available, you can check out the sample YAML here. It’s a solid starting point.
Whitelisting for cost control
Don’t be greedy with [".+"]—it’s tempting, but messy. This of course ensure complete visibility but often enough most metrics are not relevant and will not be used. Instead, add metrics one at a time or use focused patterns like ["nodejs.+"]. Precision saves money.
Tagging
As any other integration, the data sent to Datadog includes the infrastructure tags however, it is possible to enrich the data with default tags. For instance, you could add a service tag, a team tag and more. Don't hesitate to abuse of it. Since the tags are unique to all values, they do not add cardinality and do not add cost.
Ignore Tags
    ## @param ignore_tags - list of strings - optional
    ## A list of regular expressions used to ignore tags added by Autodiscovery and entries in the `tags` option.
    #
    # ignore_tags:
    #   - <FULL:TAG>
    #   - <TAG_PREFIX:.*>
    #   - <TAG_SUFFIX$>
This may look counter intuitive but this could be relevant when you have one agent collecting data from multiple external sources. In that case, the tag information regarding the agent location and its infra are not relevant to the data collected and may lead to confusion. Ignoring those tags could be a good option.
Auto Scrape
Datadog can auto-discover metrics from Prometheus endpoints (scrape doc)—but should it? Probably not. It’s like turning on all the lights when you just need the fridge. Of course, you'll get complete visibility wihtout efforts but those metrics are also counted as custom metrics and include a cost. As mentioned before a white listing approach is the recommended approach.
Metric Collection Limit
There’s a soft cap of 2,000 metrics per scrape. Not a hard wall, but if you need more, just talk to support. Remember: it’s not just metric names—every tag combo counts too. This soft limit is here to ensure the number of custom metrics does not explode without prior consent.
Conclusion
OpenMetrics may seem like just another spec at first glance—but once you get under the hood, it’s a powerful ally for anyone serious about observability. Whether you’re exploring gauges, counters, or histograms, the key lies in understanding how they behave and how Datadog interprets them. And hey, while setup is straightforward, the real magic comes from making intentional choices: whitelisting wisely, picking the right histogram configuration, and tagging like a metadata wizard.
In the end, it’s not just about collecting metrics—it’s about collecting the right metrics in a way that helps you troubleshoot faster, scale smarter, and sleep better. So go ahead, fine-tune that config, embrace percentiles when they matter, and remember: not all metrics are created equal—but with the right setup, they can all be incredibly useful.


