Level Up Your Vercel Monitoring: Advanced Datadog Integration Techniques

Using Vercel and looking for a powerful solution to monitor your app’s performance and reliability? This guide walks you through advanced observability using Datadog, going beyond the default integration to ensure your app stays optimized and running smoothly.
Basic Setup
To begin, set up the log drain to send Vercel logs to your Datadog organization. Follow the simple steps detailed here: Datadog Vercel Integration Documentation.
Once configured, your logs appear in Datadog’s Log Explorer under source:vercel. Datadog provides default log processing pipelines to automatically extract key details from your logs.
It's important to note that although Vercel integration includes metrics, these metrics are derived from logs themselves. You can review the default log-to-metric configurations here.
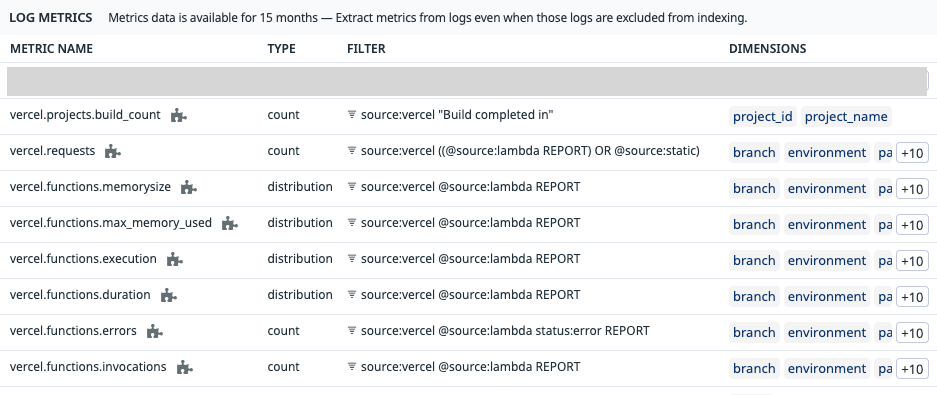
Metrics generated from logs are beneficial as they are stored for 15 months at no additional cost.
As Datadog likes to say, "Simple not simplistic"!
Enhancing Your Logs
Default logs from Vercel don't include important tags like environment (env) or team information. To improve log management and filtering, you'll need to set up additional log processing to follow best practices there.
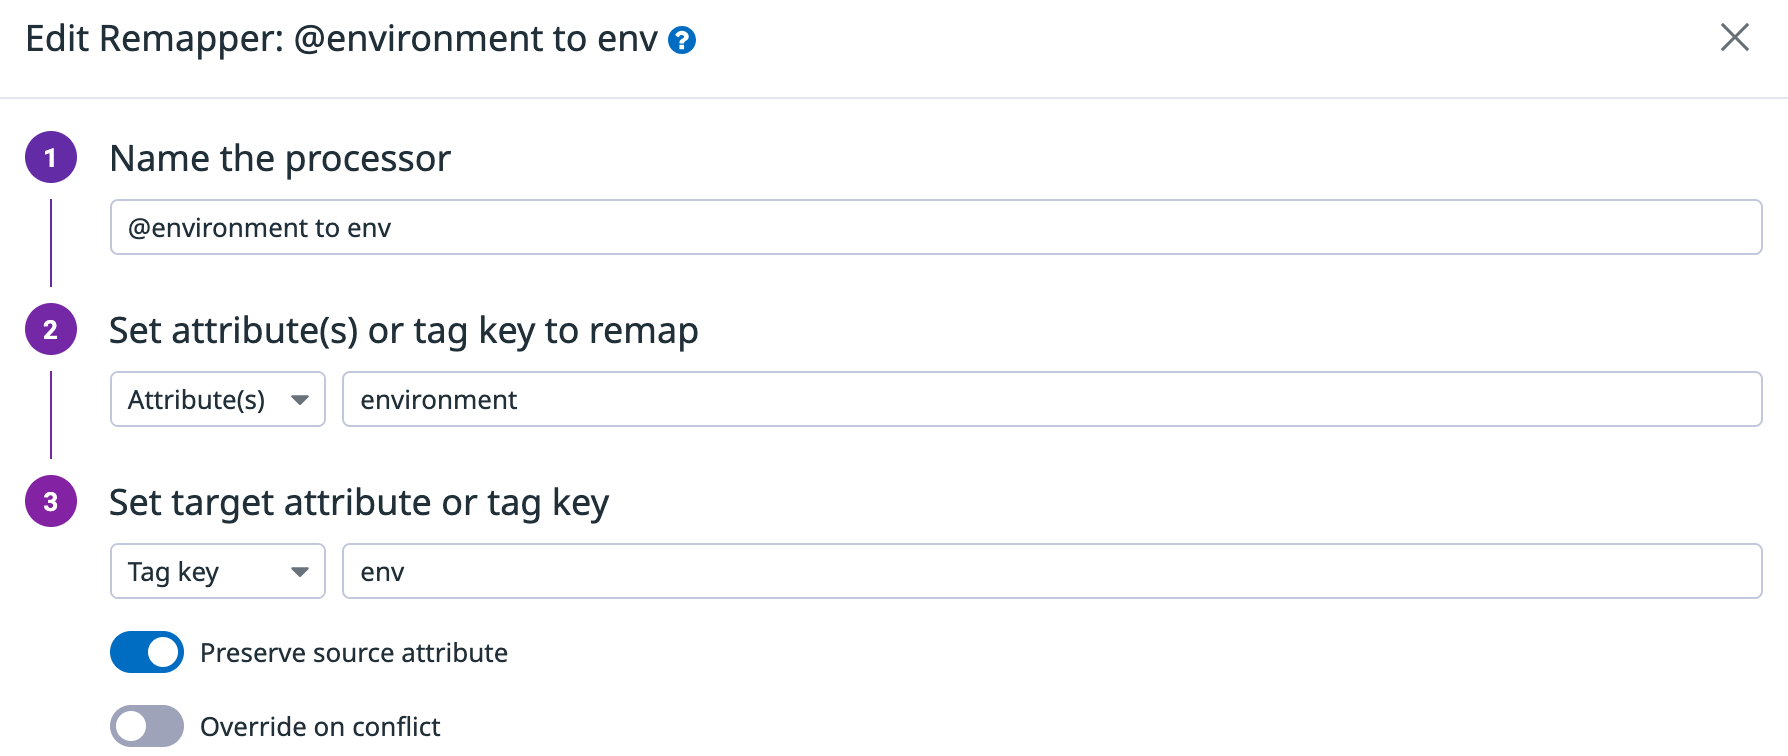
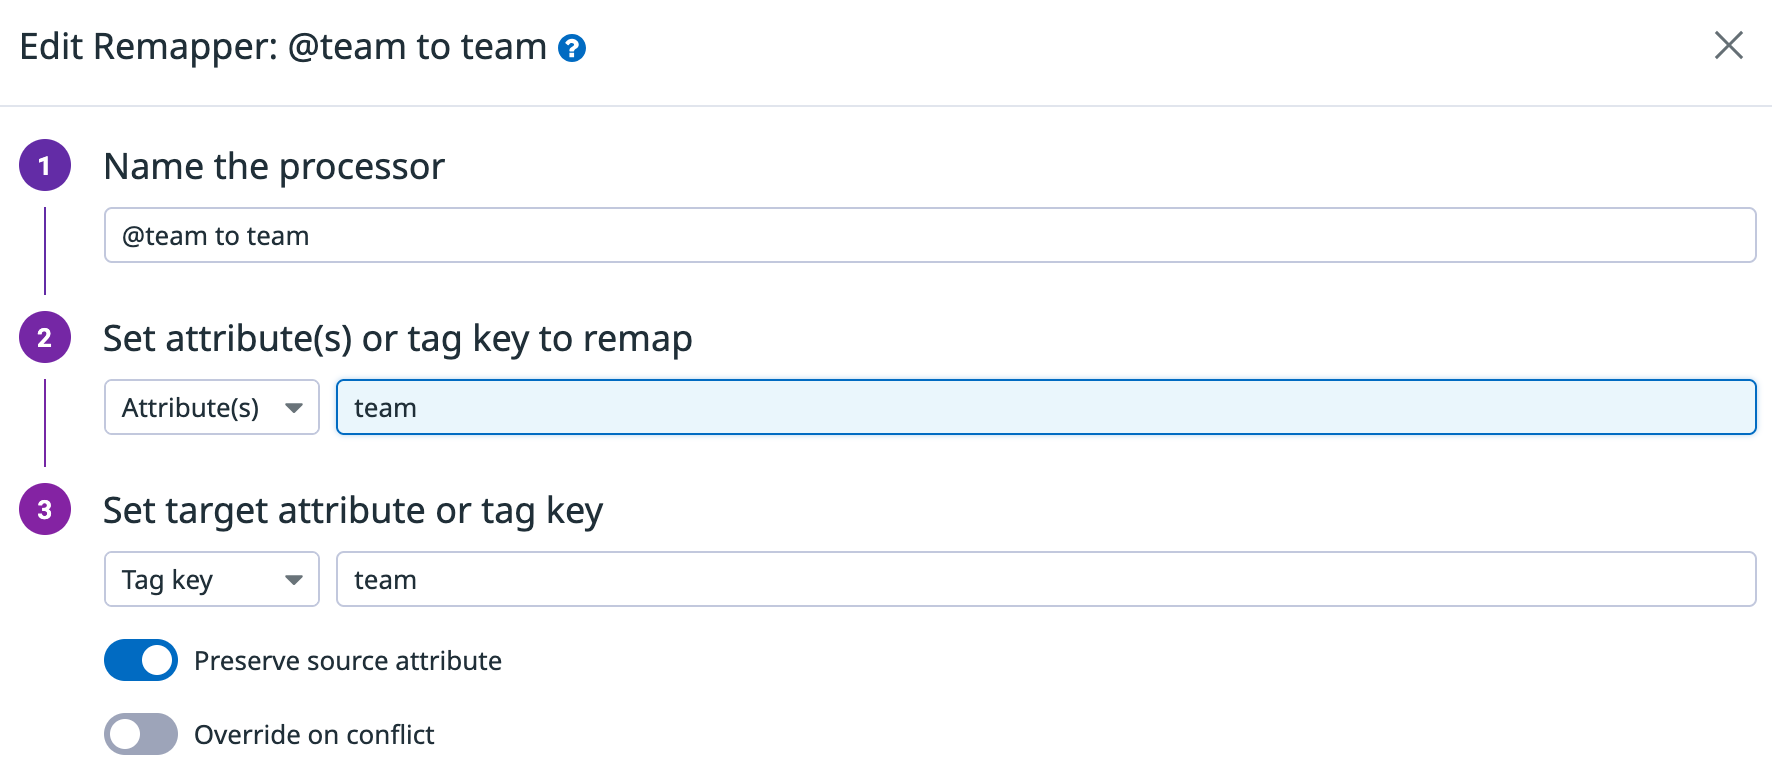
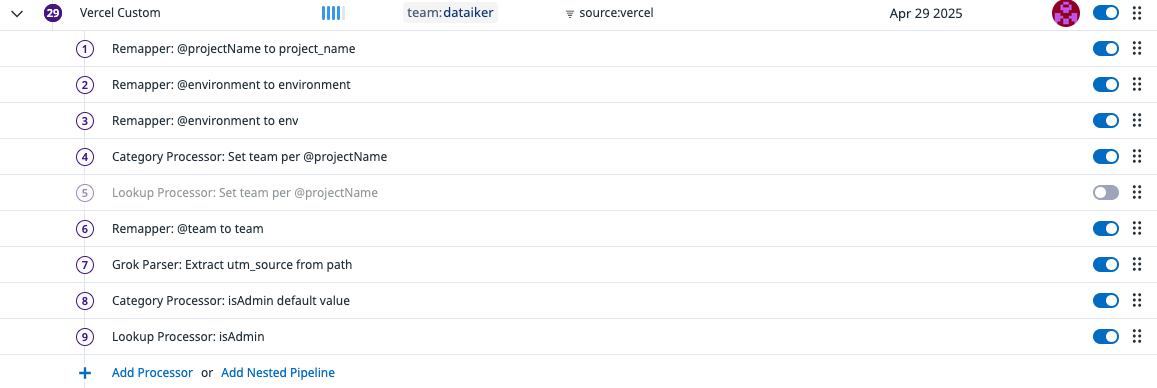
Environment Tags: Vercel logs contain an attribute called @environment. You can use Datadog’s remapper processor to map this attribute to tags env and environment.
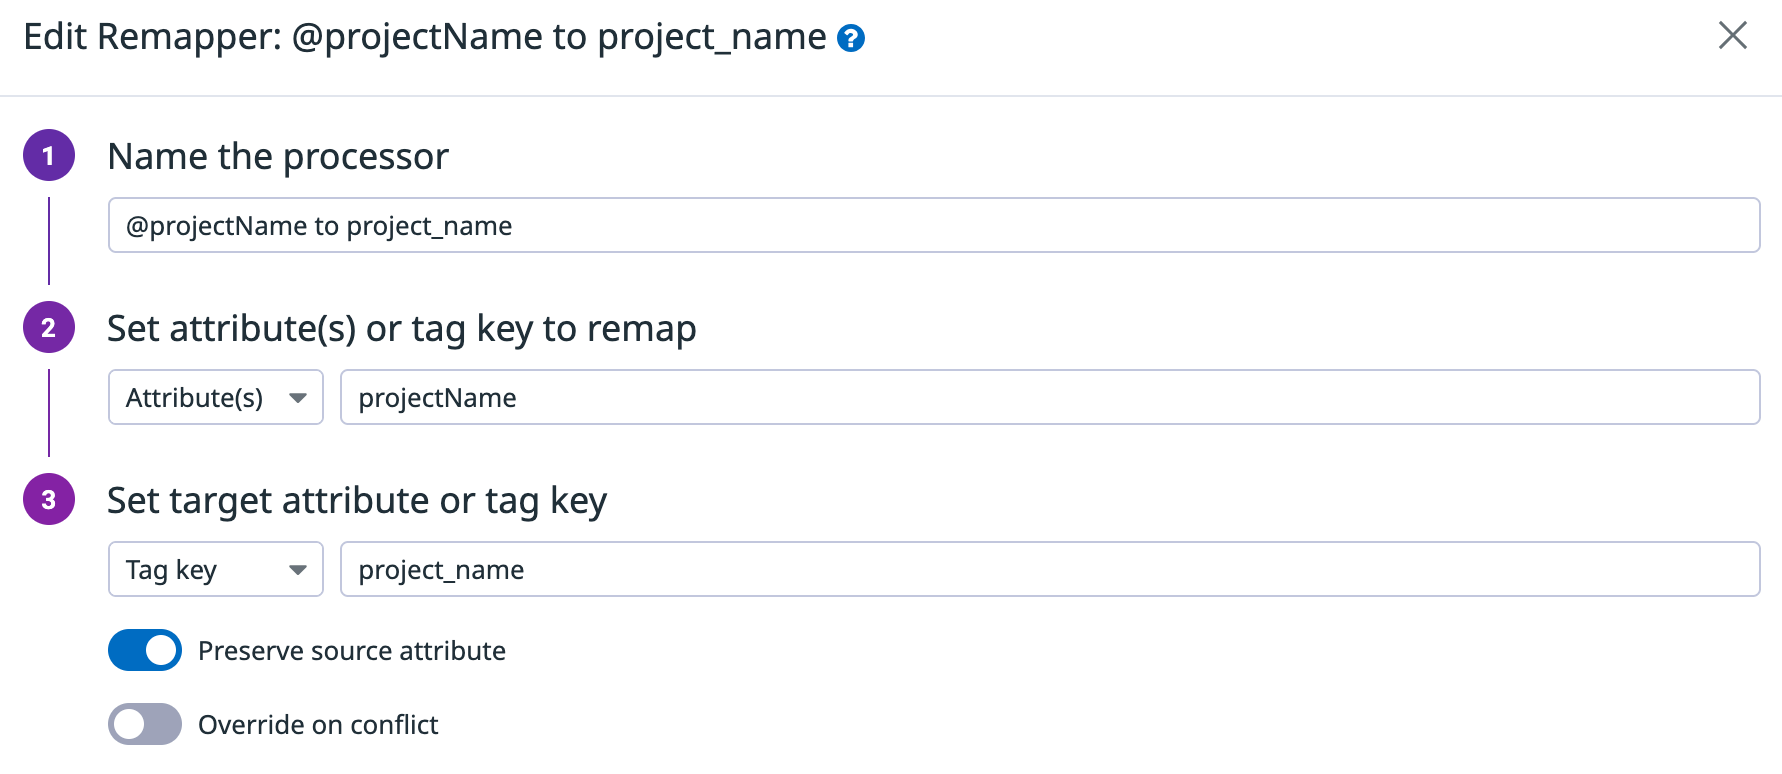
Project Name Tags: Similarly, map the attribute @projectName to the tag project_name. This alignment simplifies dashboard filtering, making metrics and logs consistent.
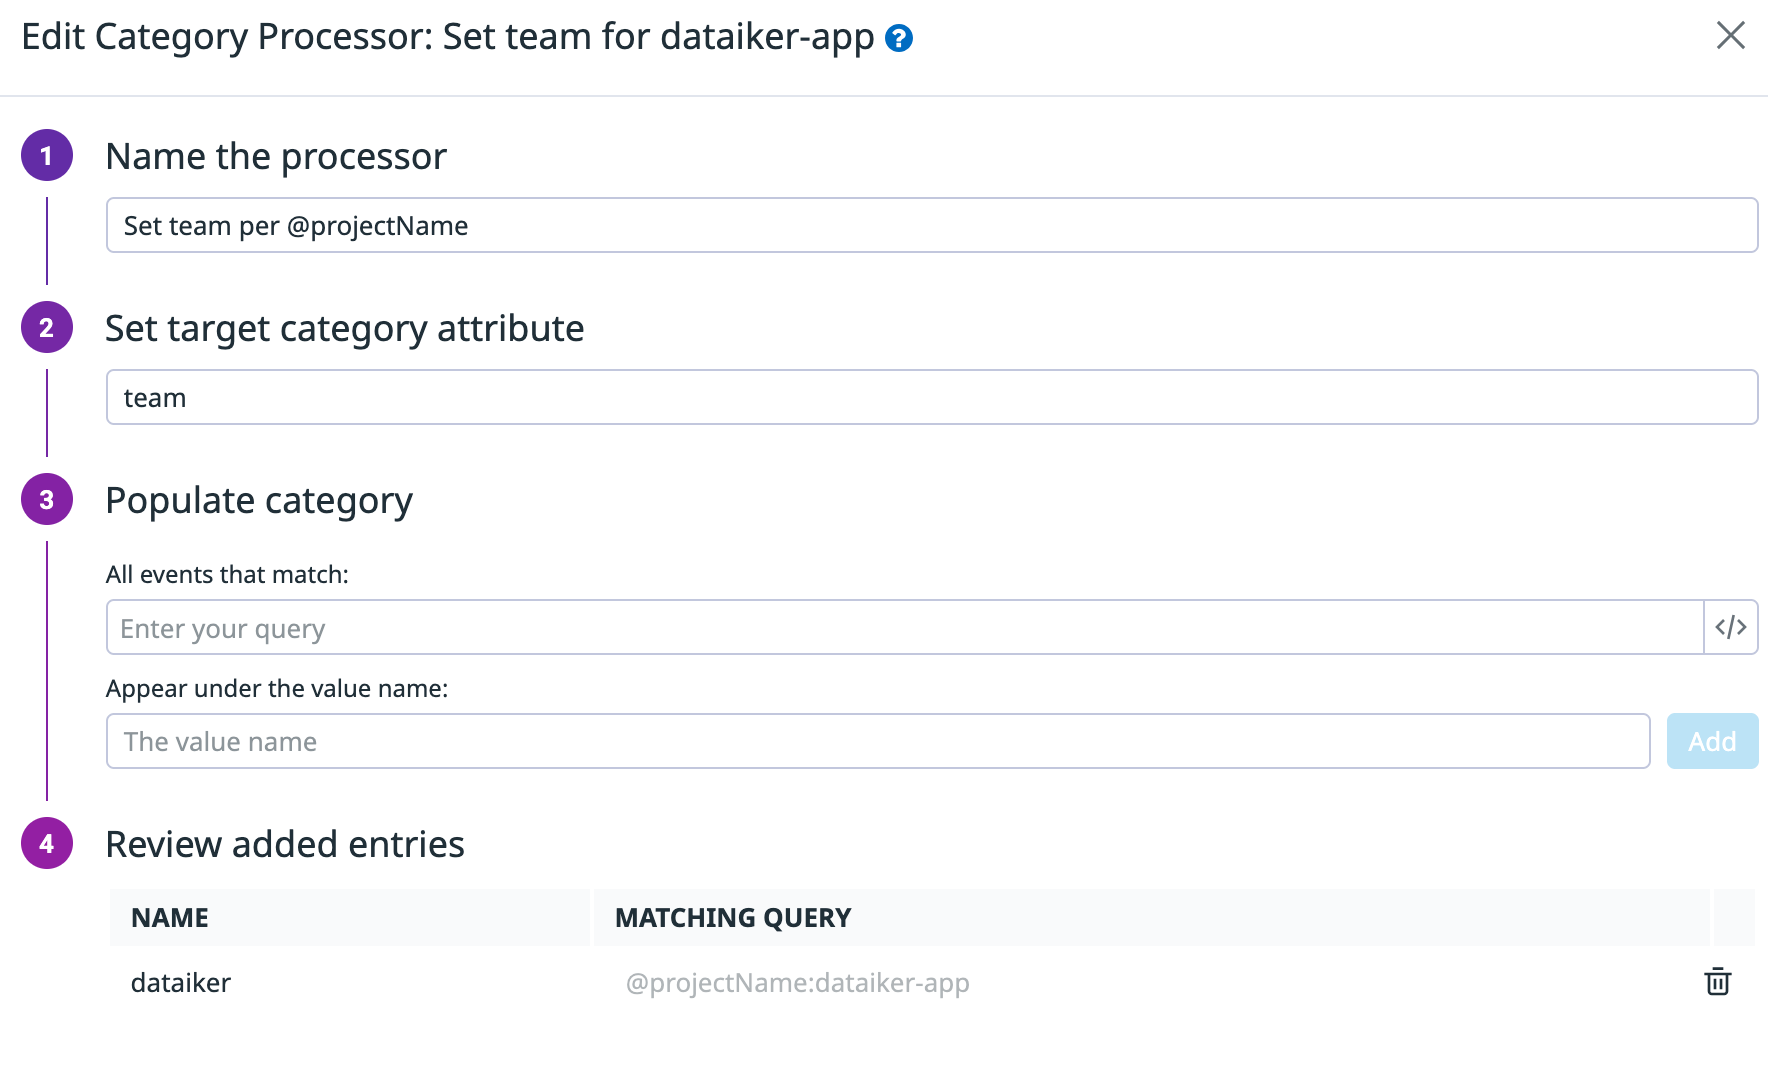
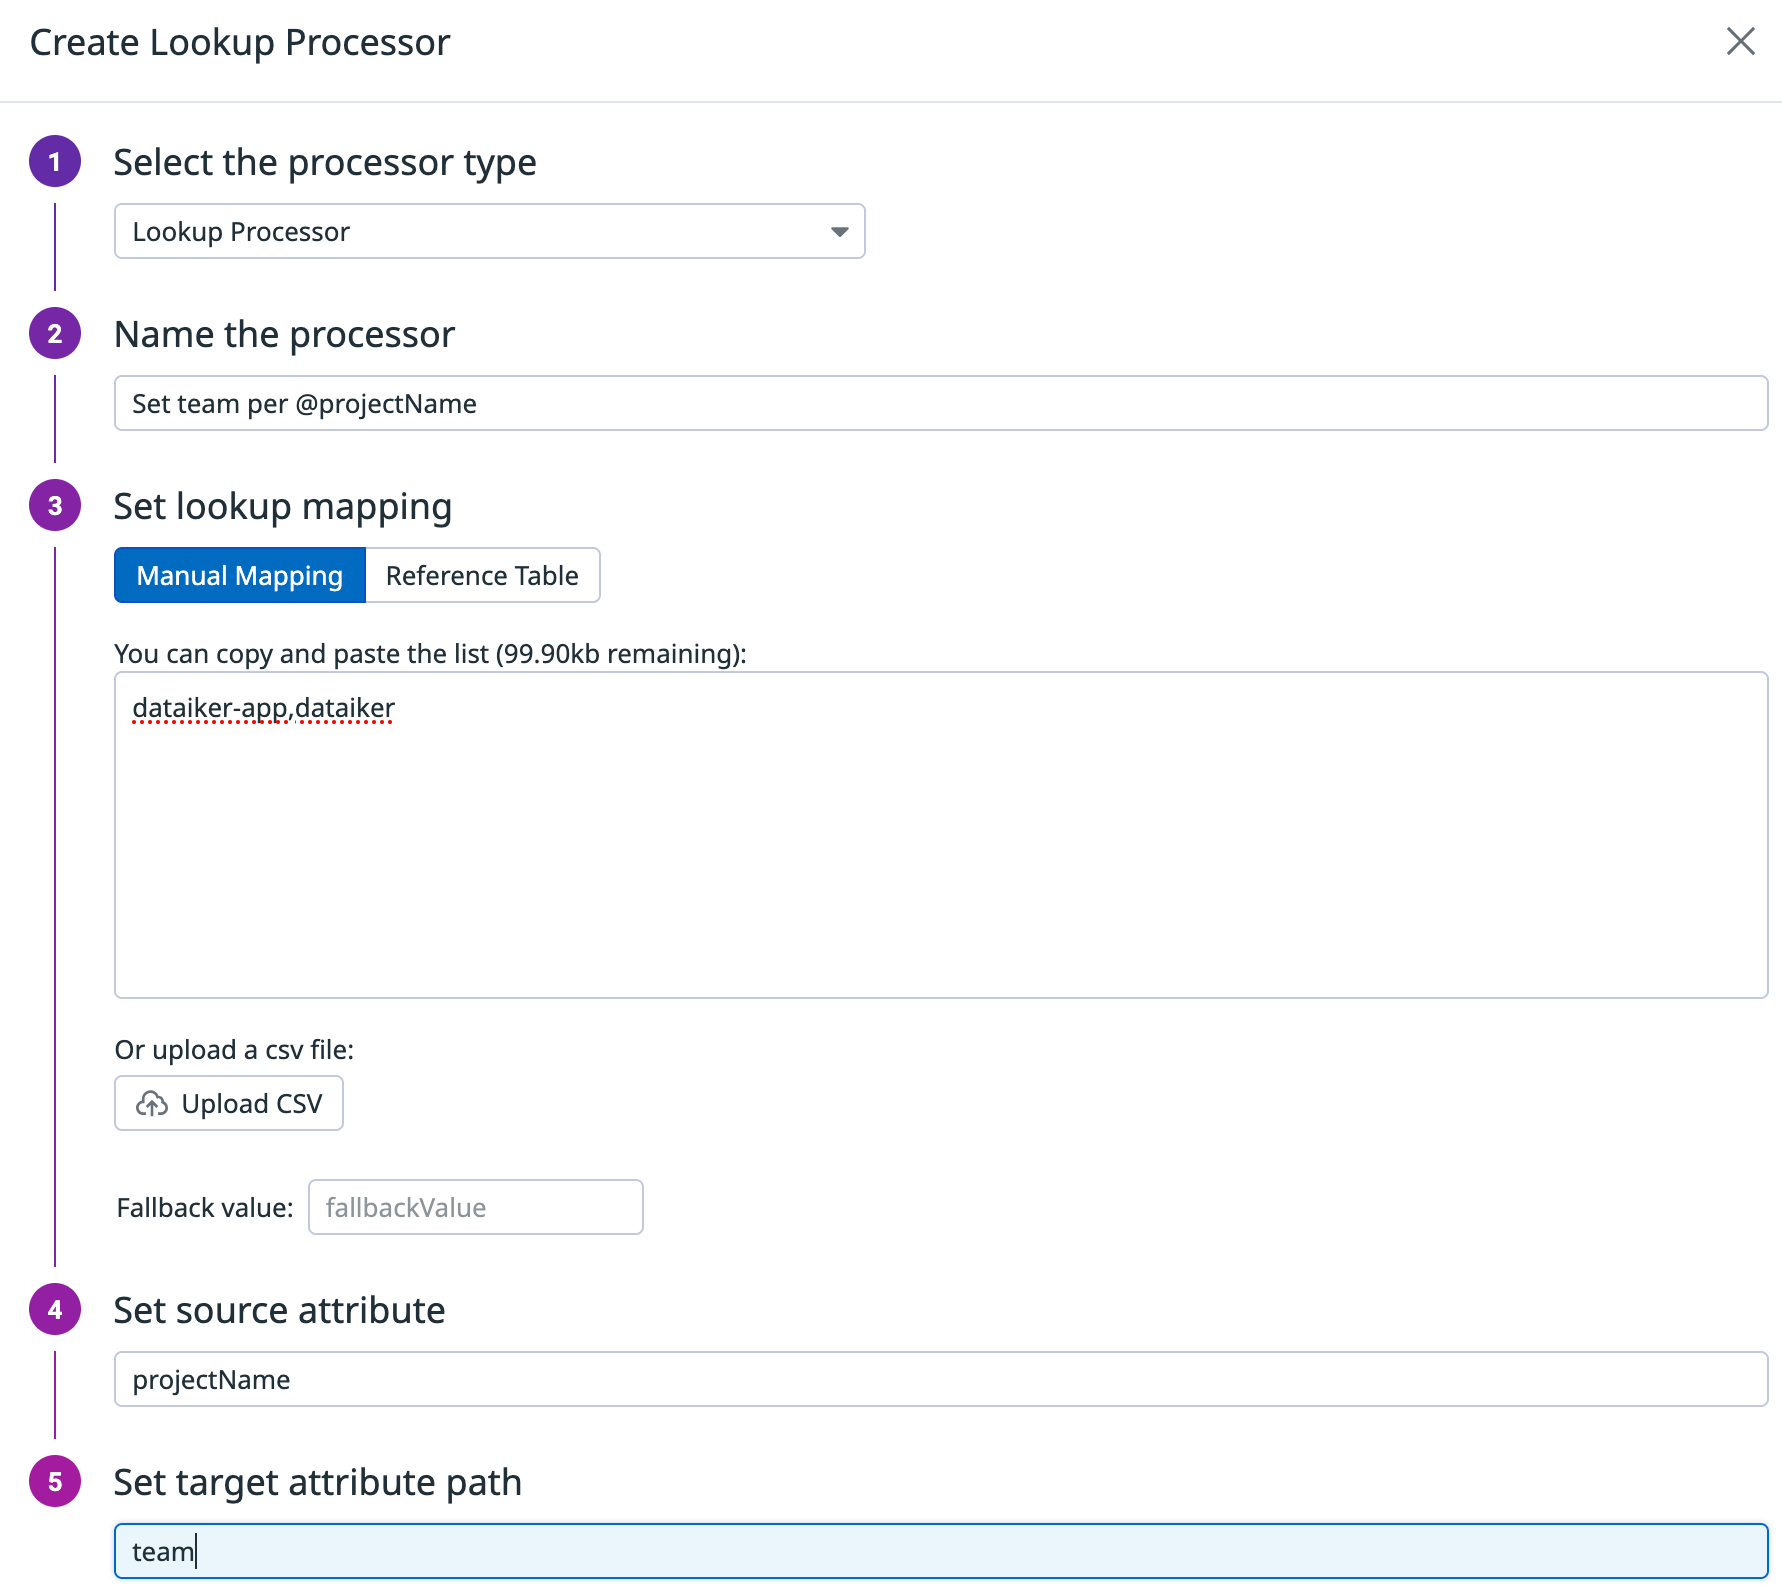
Team Tags: In large organizations, multiple teams may generate logs from different projects. Assigning a team tag to logs based on @projectName makes it easy to filter logs relevant to your team. You can achieve this using a category processor.
A lookup processor would also provide a proper tagging of your logs by associating a value for each @projectName.
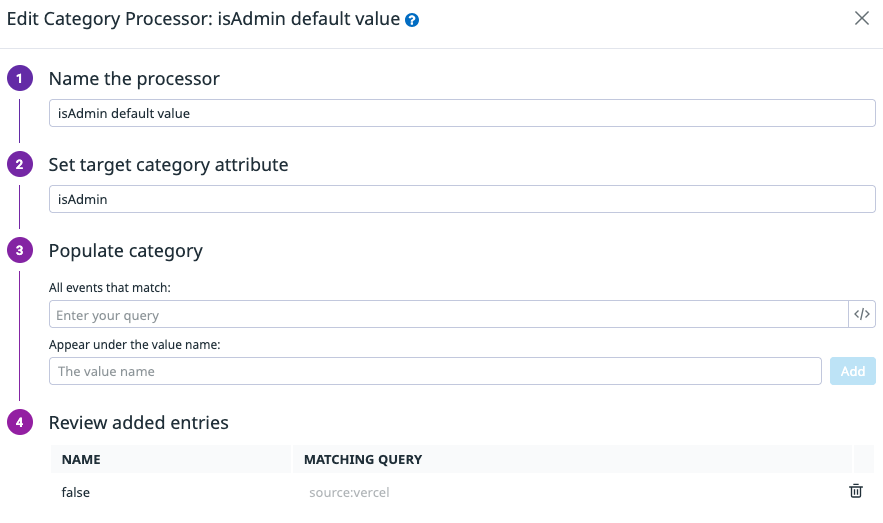
As an extra enhancement, you can also identify logs coming from your own IP address:
- Create a default value for an attribute like
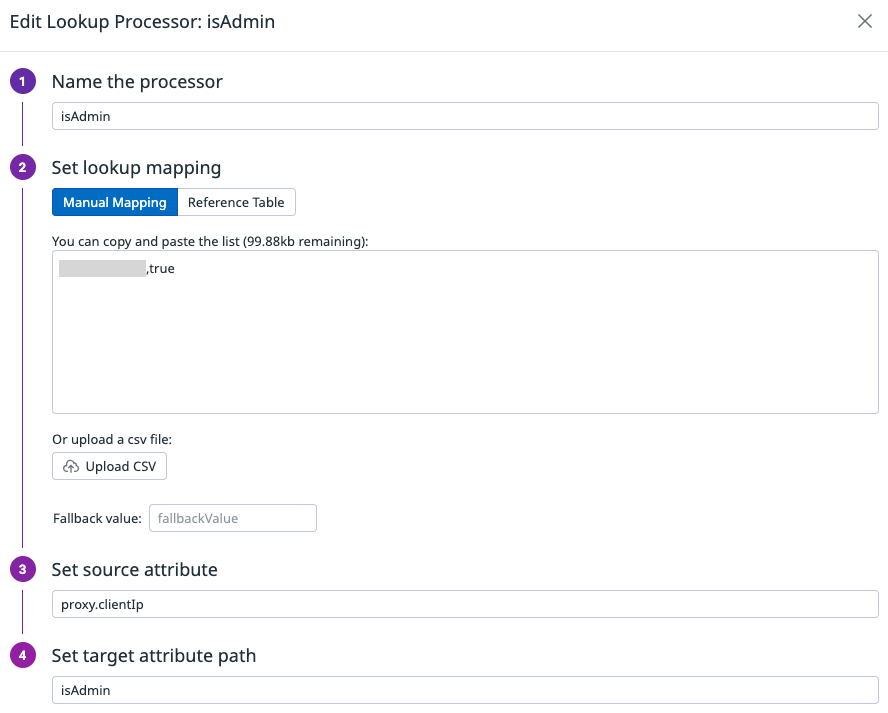
@isAdminusing a category processor. - Then use a lookup processor to adjust values based on specific IP addresses.
With such pipeline, you will have a more robust logs to ease troubleshooting and correlation. Your final pipeline should look similar to this.
Application Performance Monitoring (APM)
Vercel supports OpenTelemetry (OTel), and Datadog has an exporter compatible with it. To enable APM:
- Integrate OTel with your Vercel project by following this guide.
- Ensure the
serviceNamein your OTel configuration matches the service identifier in your logs. Check your services here.
With APM enabled, you gain powerful insights into how your app and its dependencies perform. Ensure your logs correctly associate with your APM data by matching env and service tags.
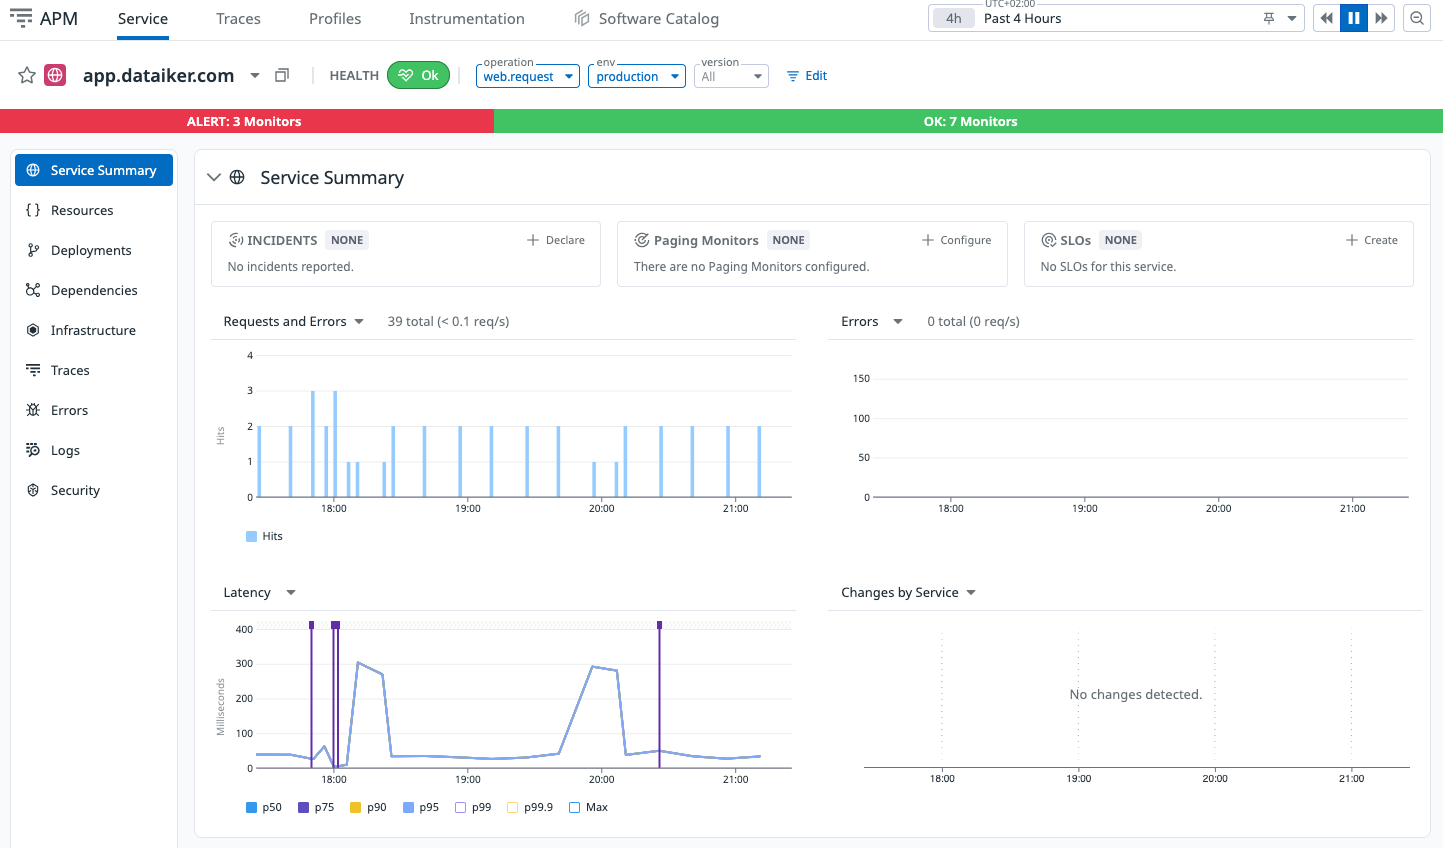
Benefits of enabling APM include:
- Unified and standardized metrics across all your services.
- Enhanced correlation of logs, metrics, monitors, incidents, and more.
- Improved understanding of service interactions and dependencies.
- Capability to add custom spans for even deeper insights (learn more).
Advanced Dashboards
Even thought Datadog provides a standard dashboard for Vercel that provides a good start, with the enhancement just completed, we can go a step further.
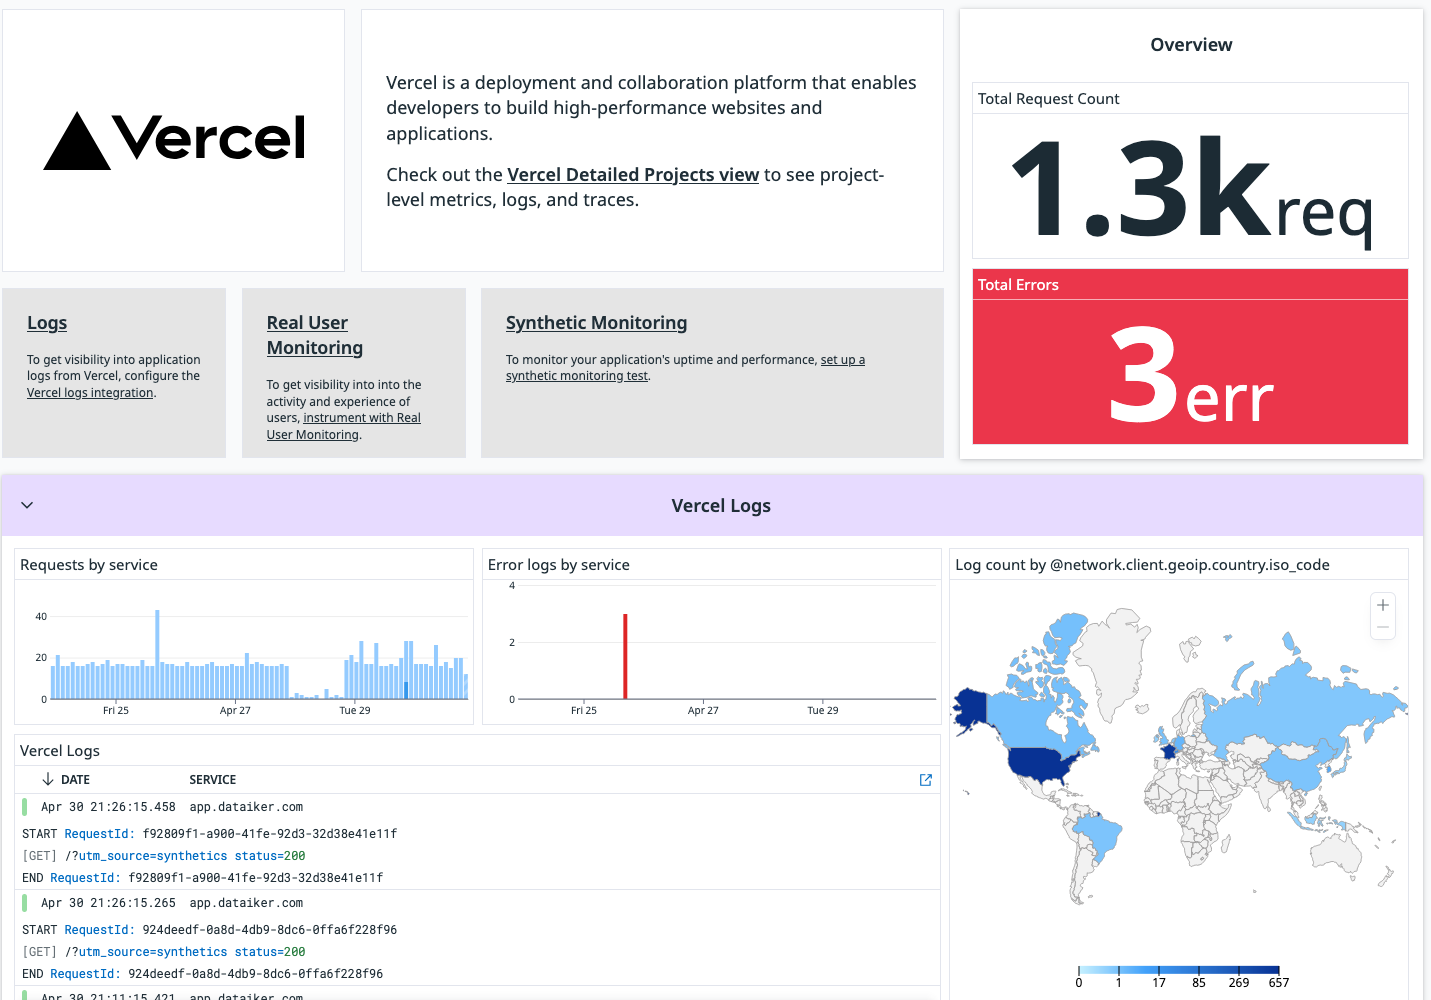
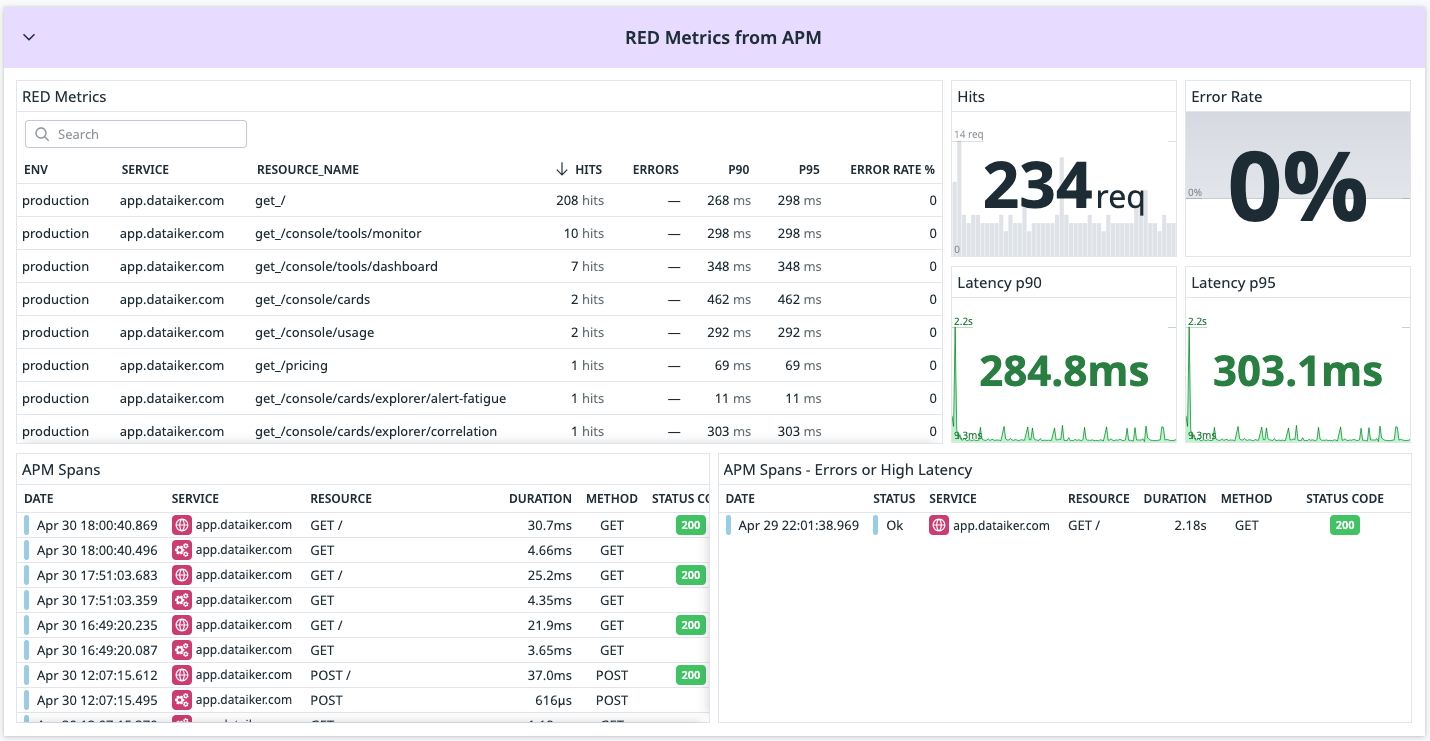
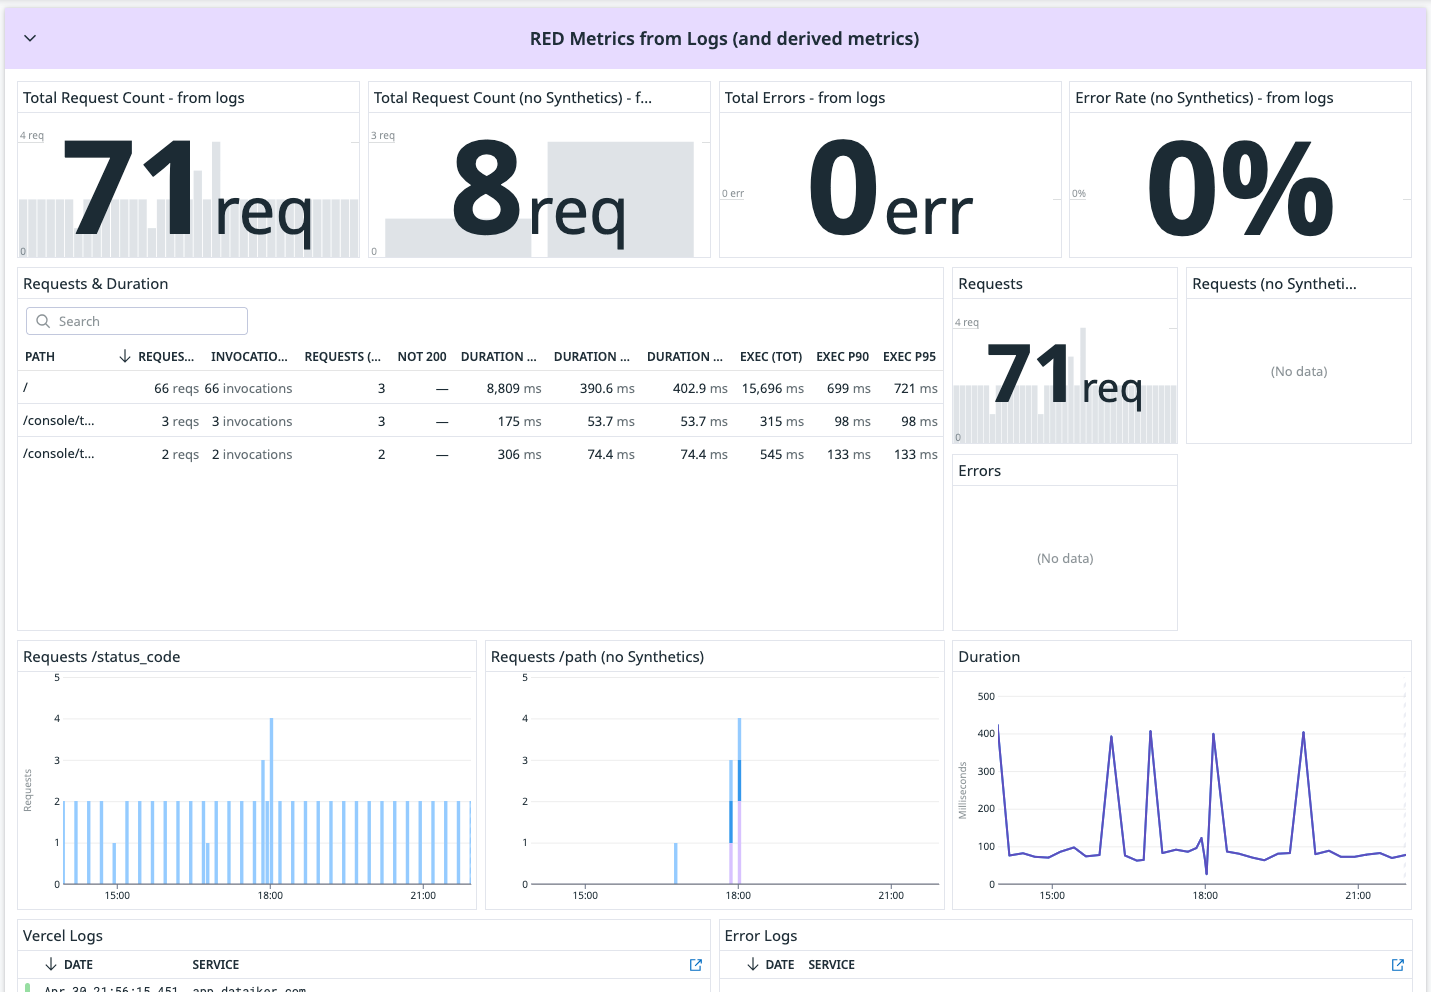
Once you have enhanced logs and APM configured, you can leverage your own Datadog custom dashboards to visualize this data effectively. Here’s what an advanced Vercel dashboard includes:
- APM Metrics: Standard RED (Rate, Errors, Duration) metrics, alongside specific queries to track spans, errors, and latency issues. For instance, in our case, we added a span query for errors and high latency spans.
- Log Insights: Logs visualization and Metrics derived from logs. From the log itself, we also excluded in some widgets the synthetic traffic thanks to our custom pipeline which exposes the
utm_source.
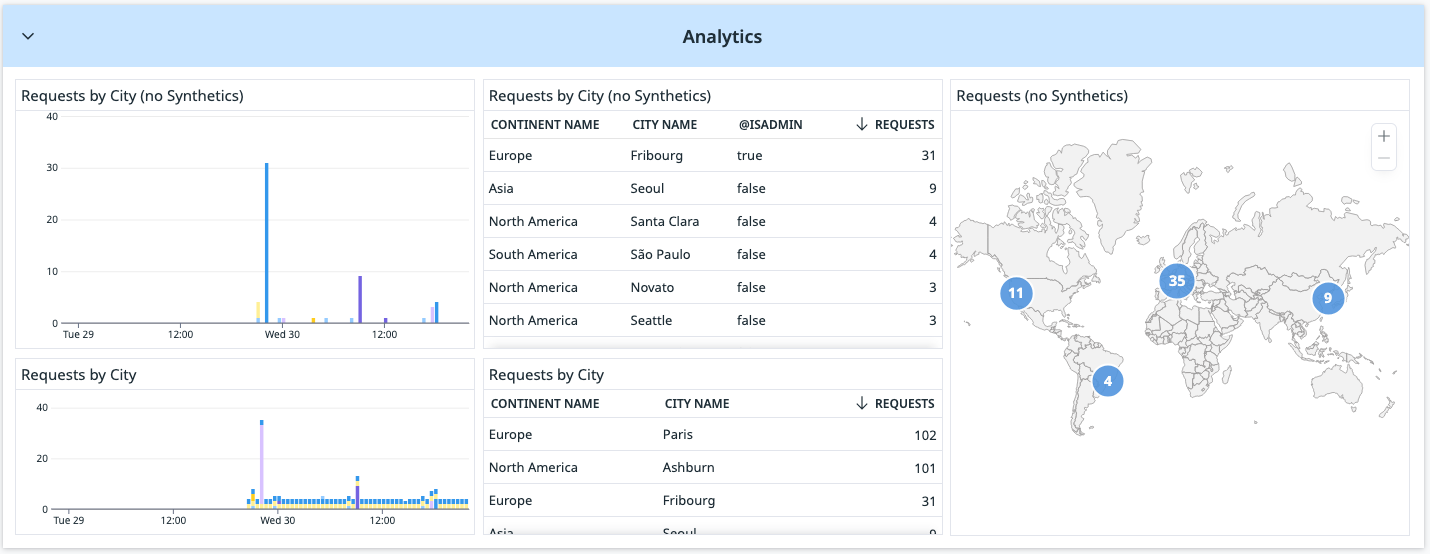
- Geolocation: Utilize user IP addresses from logs with a GeoIP processor to gain insights into user distribution.
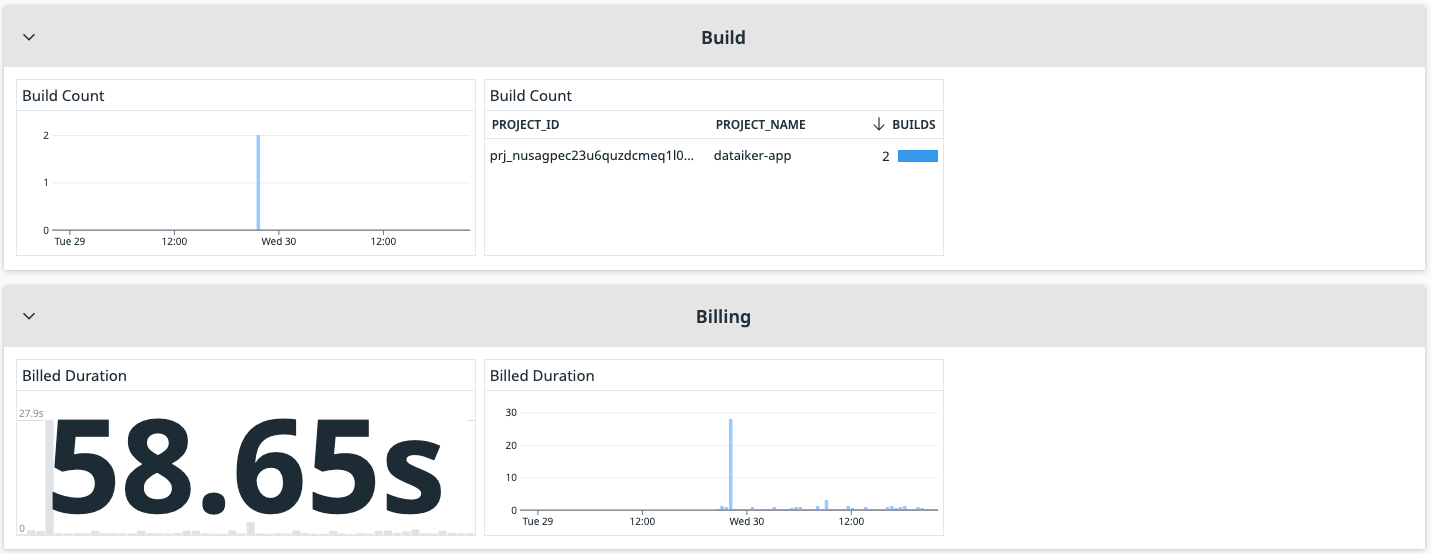
- Build Information: Track the number of builds and Vercel’s billed durations.
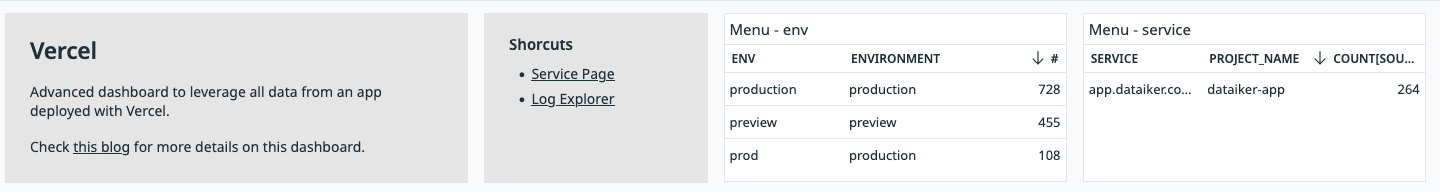
As a bonus, at the top, I added a menu. If you are not sure on how to use it, click on any row and set the template variables from there.
Conclusion
While Vercel and Datadog offer powerful default integration tools, making these additional configurations significantly enhances your monitoring capabilities. By following these steps, you'll achieve clearer, more actionable insights, making your troubleshooting faster and simpler.