Get the Signal, Skip the Noise: Expert Tips for Datadog Monitoring

Reliable systems start with effective monitoring—but without careful configuration, monitors can easily generate noise instead of insights. As infrastructure scales, it's crucial that alerts distinguish real problems from transient issues. In this guide, we’ll walk through best practices for configuring Datadog monitors that prioritize meaningful signals over noise—helping your team respond to what really matters.
Monitor Query System
Datadog’s query system is largely consistent across dashboards, notebooks, and monitors—but when it comes to monitors, their scheduled nature introduces some unique configuration details to consider. If you’d like a quick primer on how metrics and queries work, revisit our article: Datadog Metrics: The Core Concepts for Success
Fundamentals: Evaluation Window and Evaluation Frequency
⏱️ The evaluation window (also called evaluation period) refers to the time period over which data is evaluated to determine whether a monitor (or alert) should trigger. In simple terms: it’s how far back in time the monitor looks at the data to decide if the conditions you've set (like thresholds) are met to trigger an alert.

⏱️ The evaluation frequency (sometimes called check interval or monitor interval) refers to how often the monitoring system checks the data against the alert condition.
These two settings are closely linked in Datadog: longer windows typically lead to less frequent evaluations. But keep in mind, even with a one-hour window, Datadog still checks conditions every minute. Learn more.

Alert on Symptoms not Causes
The most effective alerts focus on symptoms—what users actually feel—rather than internal system metrics. Instead of triggering on isolated CPU or memory spikes, monitor user-facing indicators like error rates, login failures, or page load times. This approach ensures your alerts are tied to real-world impact, cuts down on unnecessary noise, and helps teams stay focused on the issues that matter most.
Reducing Alert Noise 🚨
“Flappy” monitors—those that frequently toggle between alert and recovery—are a major source of alert fatigue. To reduce noise, start by tuning your evaluation window.
1️⃣ Use appropriate evaluation windows ⏳: Longer windows reduce sensitivity to brief spikes
It’s common to think a shorter window (like 5 minutes or less) will make alerts fire faster. While that’s technically true, the monitor still evaluates every minute. The real risk? Short windows can overreact to brief anomalies, creating noise that undermines trust in your alerts.
✅ Longer windows may delay detection slightly, but they produce more stable, actionable alerts.
In a nutshell:
- A shorter window = quicker detection, but more prone to false positives (due to short spikes).
- A longer window = more stable, but slower to detect real issues.
// Instead of:
Trigger when: Average of the last 1 minute > 90%

// Consider:
Trigger when: Average of the last 5 minutes > 90%
2️⃣ Implement recovery thresholds 📉: Set thresholds that require metrics to improve significantly before resolving (advanced)
A recovery threshold adds an extra condition for when an alert can resolve—ensuring the system is truly healthy before clearing. Learn more.
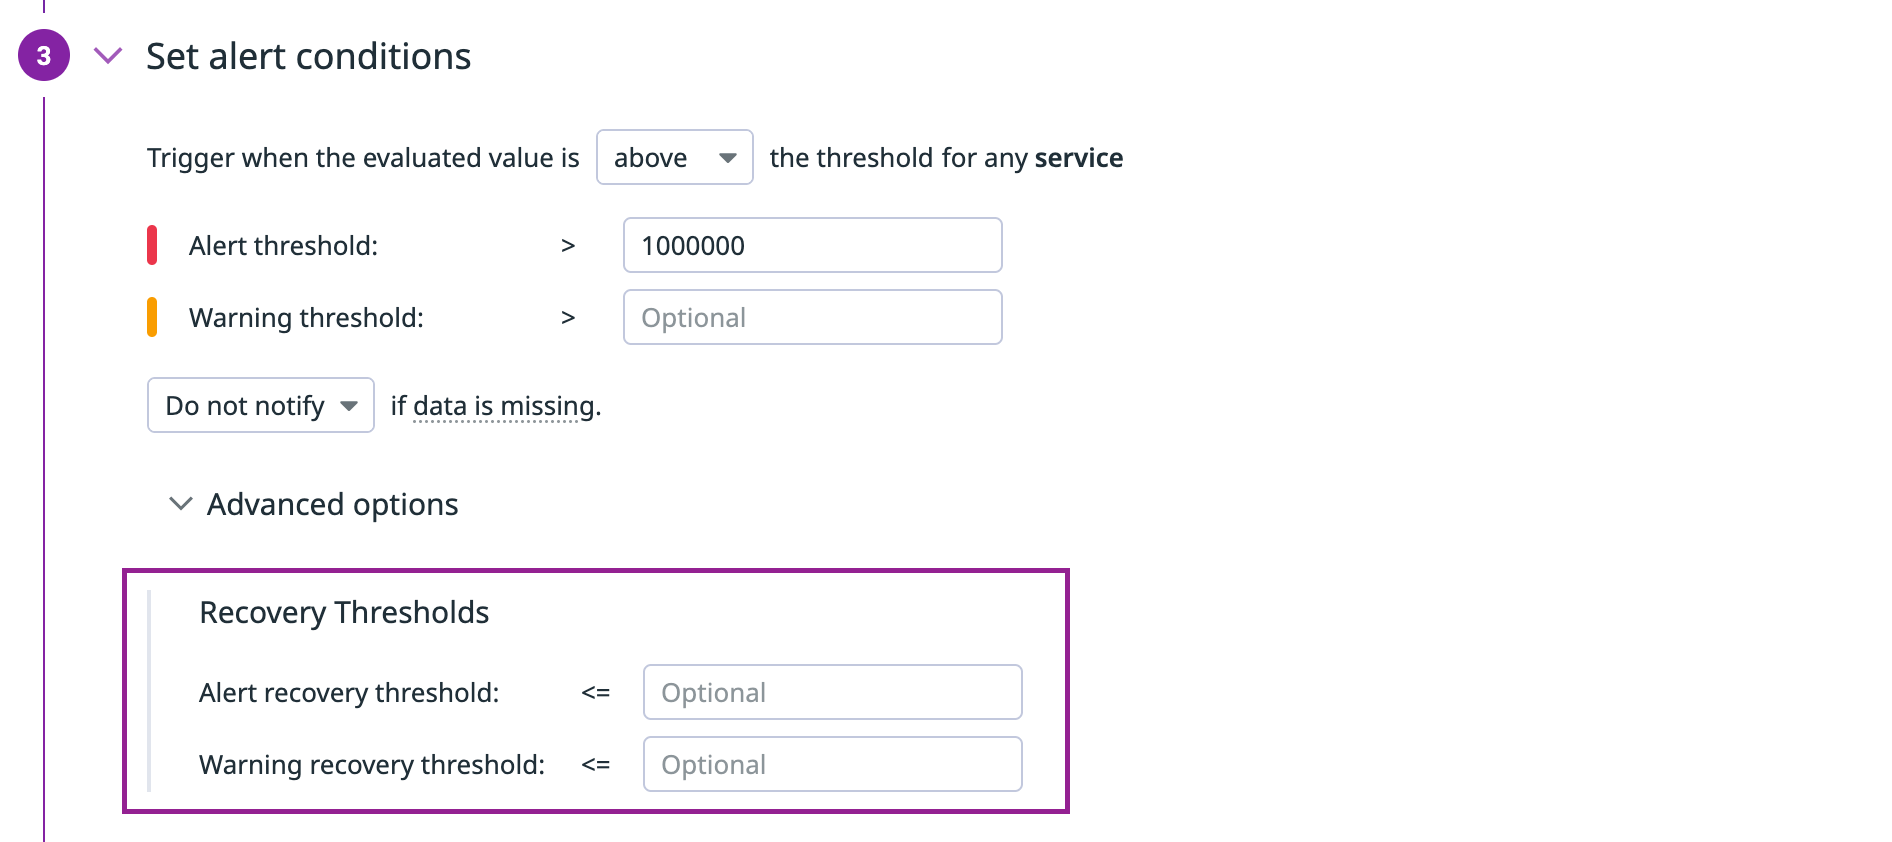
For instance in the example below, we can alert when the disk capacity is full at 90% but only recover when the capacity goes back to below 80%.
// Alert threshold:
Alert when: > 90%

// Recovery threshold:
Recover when: < 80%
⚠️ This system helps prevent premature recoveries, but keep in mind: recovery thresholds introduce complexity. In high-stress moments (think 3AM incidents), clarity matters. Use this feature selectively.
3️⃣ Use "at all times" for sensitive metrics 🔍: This triggers alerts only when all data points within the evaluation window violate the threshold.
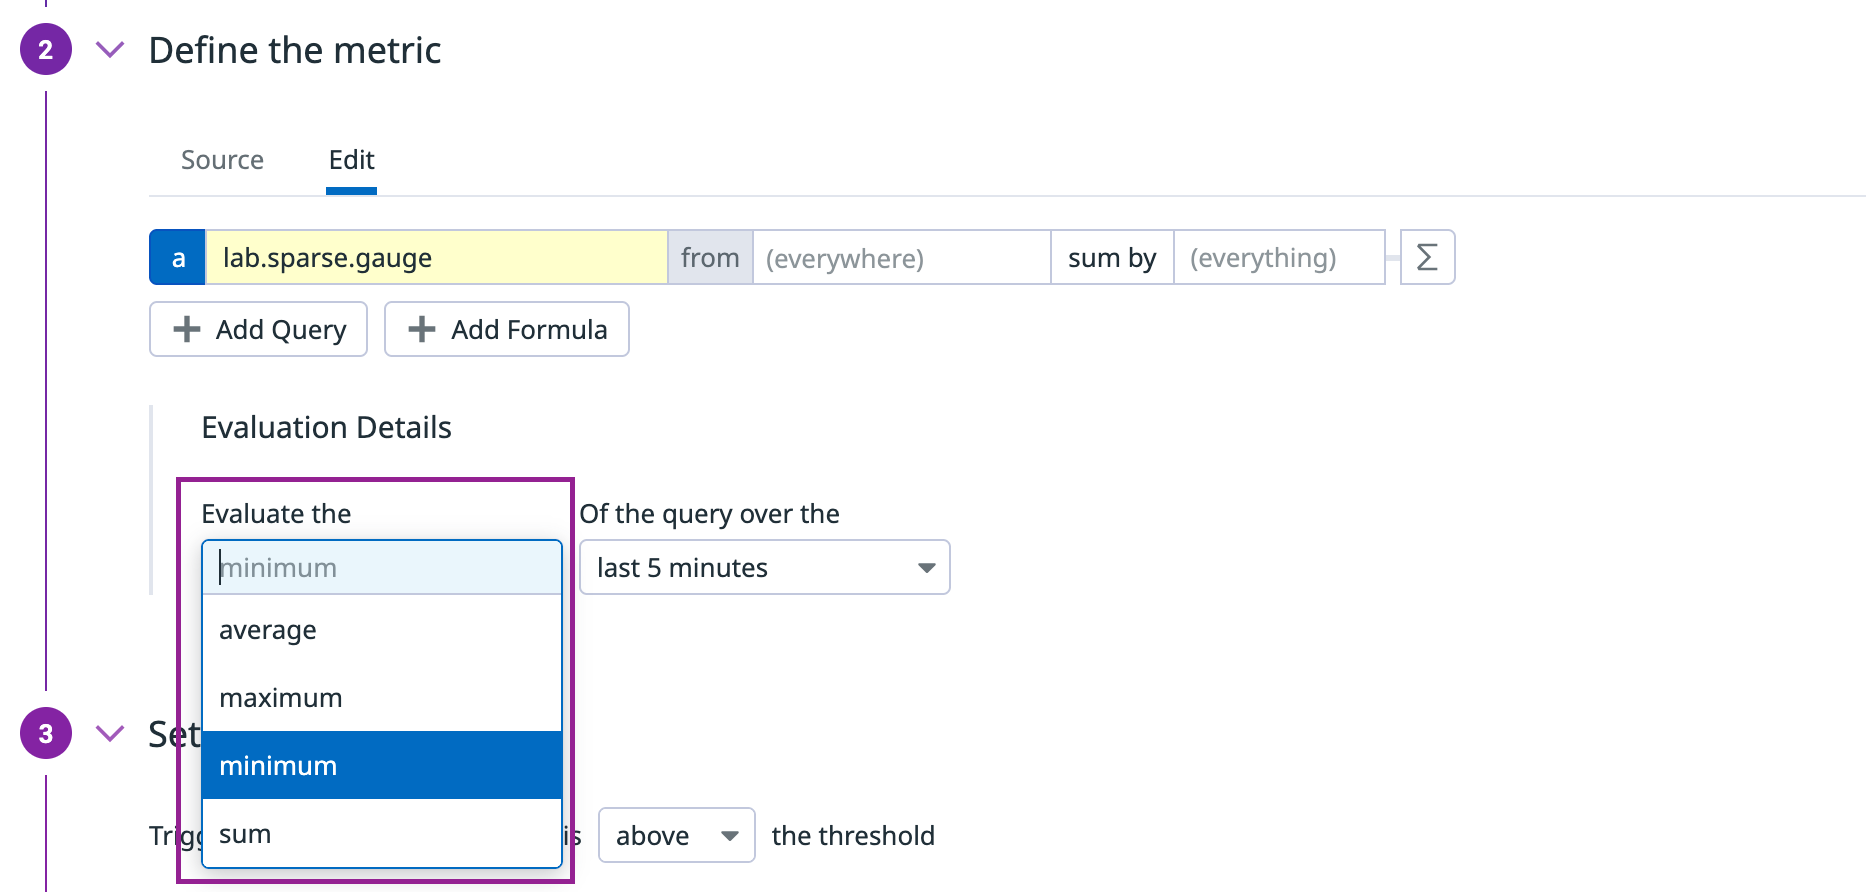
// For metrics that change frequently:
Alert when: At all times over the last 5 minutes > 90%Now that we’ve covered how to reduce noise, let’s look at how to ensure your queries are accurate and delay-tolerant.
Writing High-Quality Alerts
Evaluation delay
Cloud provider metrics (especially AWS CloudWatch) often have inherent delays in data collection. To account for this, Datadog recommends setting an evaluation delay of 300+ seconds (5 minutes) up to 15 minutes for cloud metrics.
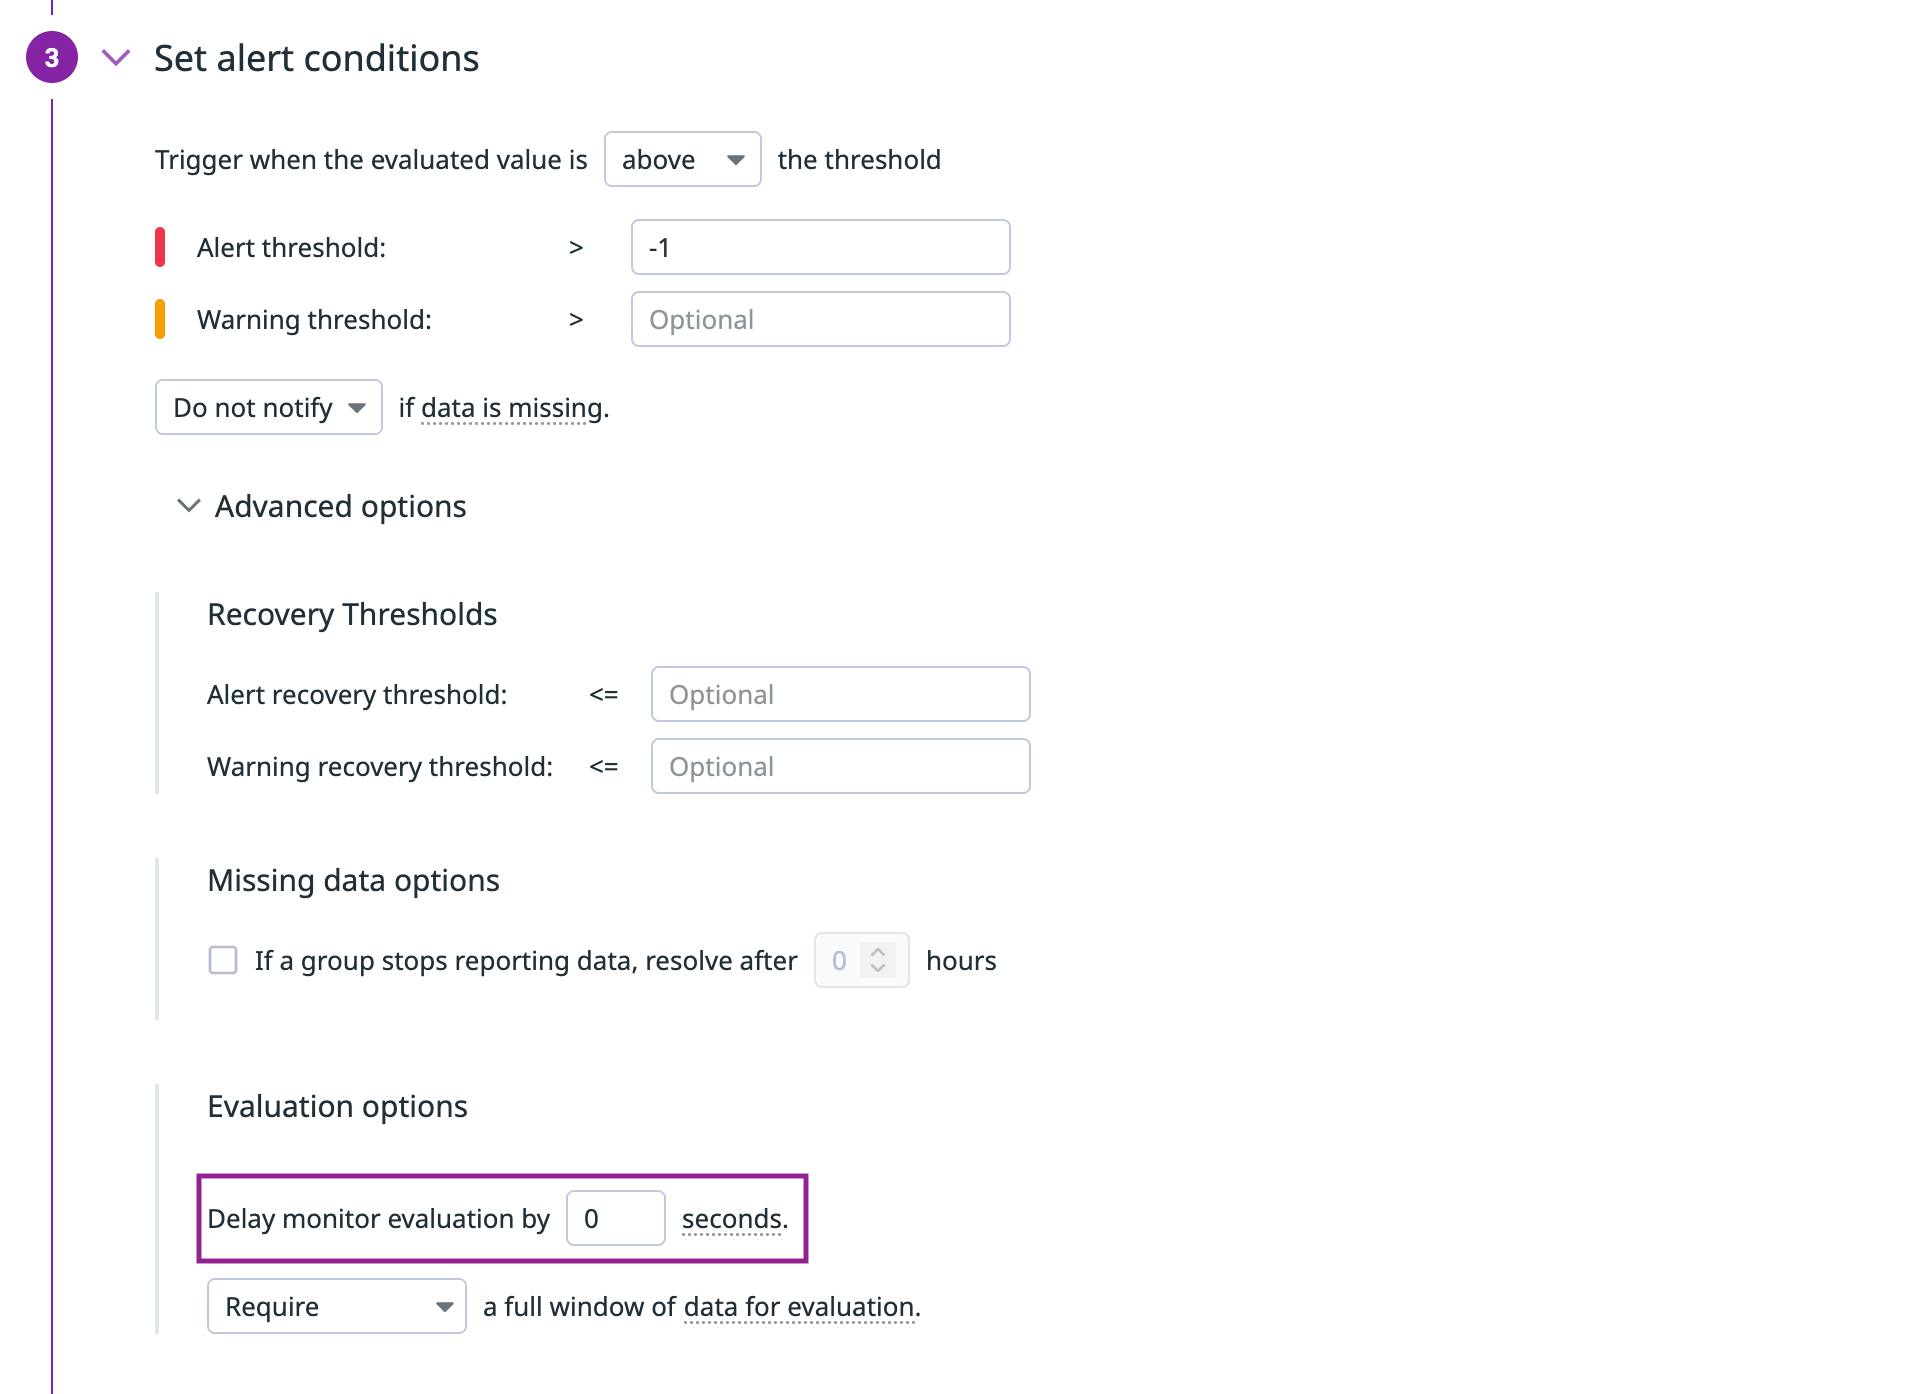
This ensures that your monitor doesn't evaluate incomplete data, which can lead to false positives or missed alerts. For critical production alerts, you can set lower delays but should design your monitors to handle potential data gaps
// For AWS CloudWatch metrics
Evaluation delay: 900 seconds (15 minutes)
Data Density for Anomaly Detection
Anomaly detection relies on having enough data to identify what “normal” looks like. Datadog recommends at least five data points within your alert window to establish a reliable baseline.
Too few points? One or two outliers can skew the algorithm, producing unstable results and frequent false positives. Always check your data density before enabling anomaly detection.
Handling "No Data" States Effectively
What should happen when a service stops sending data? Datadog offers three options for handling “no data” states:
- Notify: Alert when data is missing
- Do Not Notify: Ignore missing data
- Auto-resolve: Clear alerts automatically
Use “Notify” for critical systems where missing data might indicate a problem. For low-priority or infrequent metrics, “Do Not Notify” can help reduce noise.

Crafting Informative Alert Messages 🛠️
A well-crafted alert message provides the necessary context to understand and address the issue quickly.
When humans are necessary, we have found that thinking through and recording the best practices ahead of time in a "playbook" produces roughly a 3x improvement in MTTR as compared to the strategy of "winging it." - Google SRE Book
Components of an Effective Alert Message
- Clear description of the issue: What happened?
- Affected resources: Where is the problem occurring?
- Severity and impact: How serious is the issue?
- Troubleshooting steps or links: How can it be fixed?
- Recovery instructions: What should be done after resolving the issue?
Using Links and Runbooks
Include links to relevant dashboards, documentation, or runbooks in your alert messages. This provides immediate access to troubleshooting resources.
In the example below, we can observer multiple links added, a list of actions to take which will help even the newest team member getting started at 2am on Saturday.
{{#is_alert}}
High error rate detected for service:{{service}} in {{env}}!

Current value: {{value}} errors per minute (threshold: {{threshold}})

Potential impact: Users may experience service disruptions.

Troubleshooting:
1. Check error logs: https://app.datadoghq.com/logs?query=service:{{service}}%20status:error
2. View service dashboard: https://app.datadoghq.com/dashboard/abc123/{{service}}-overview
3. Follow runbook: https://wiki.example.com/runbooks/{{service}}/high-error-rate

Notify: @team-{{team}} @slack-{{team}}-alerts
{{/is_alert}}
Dynamic Notification with Conditional Logic
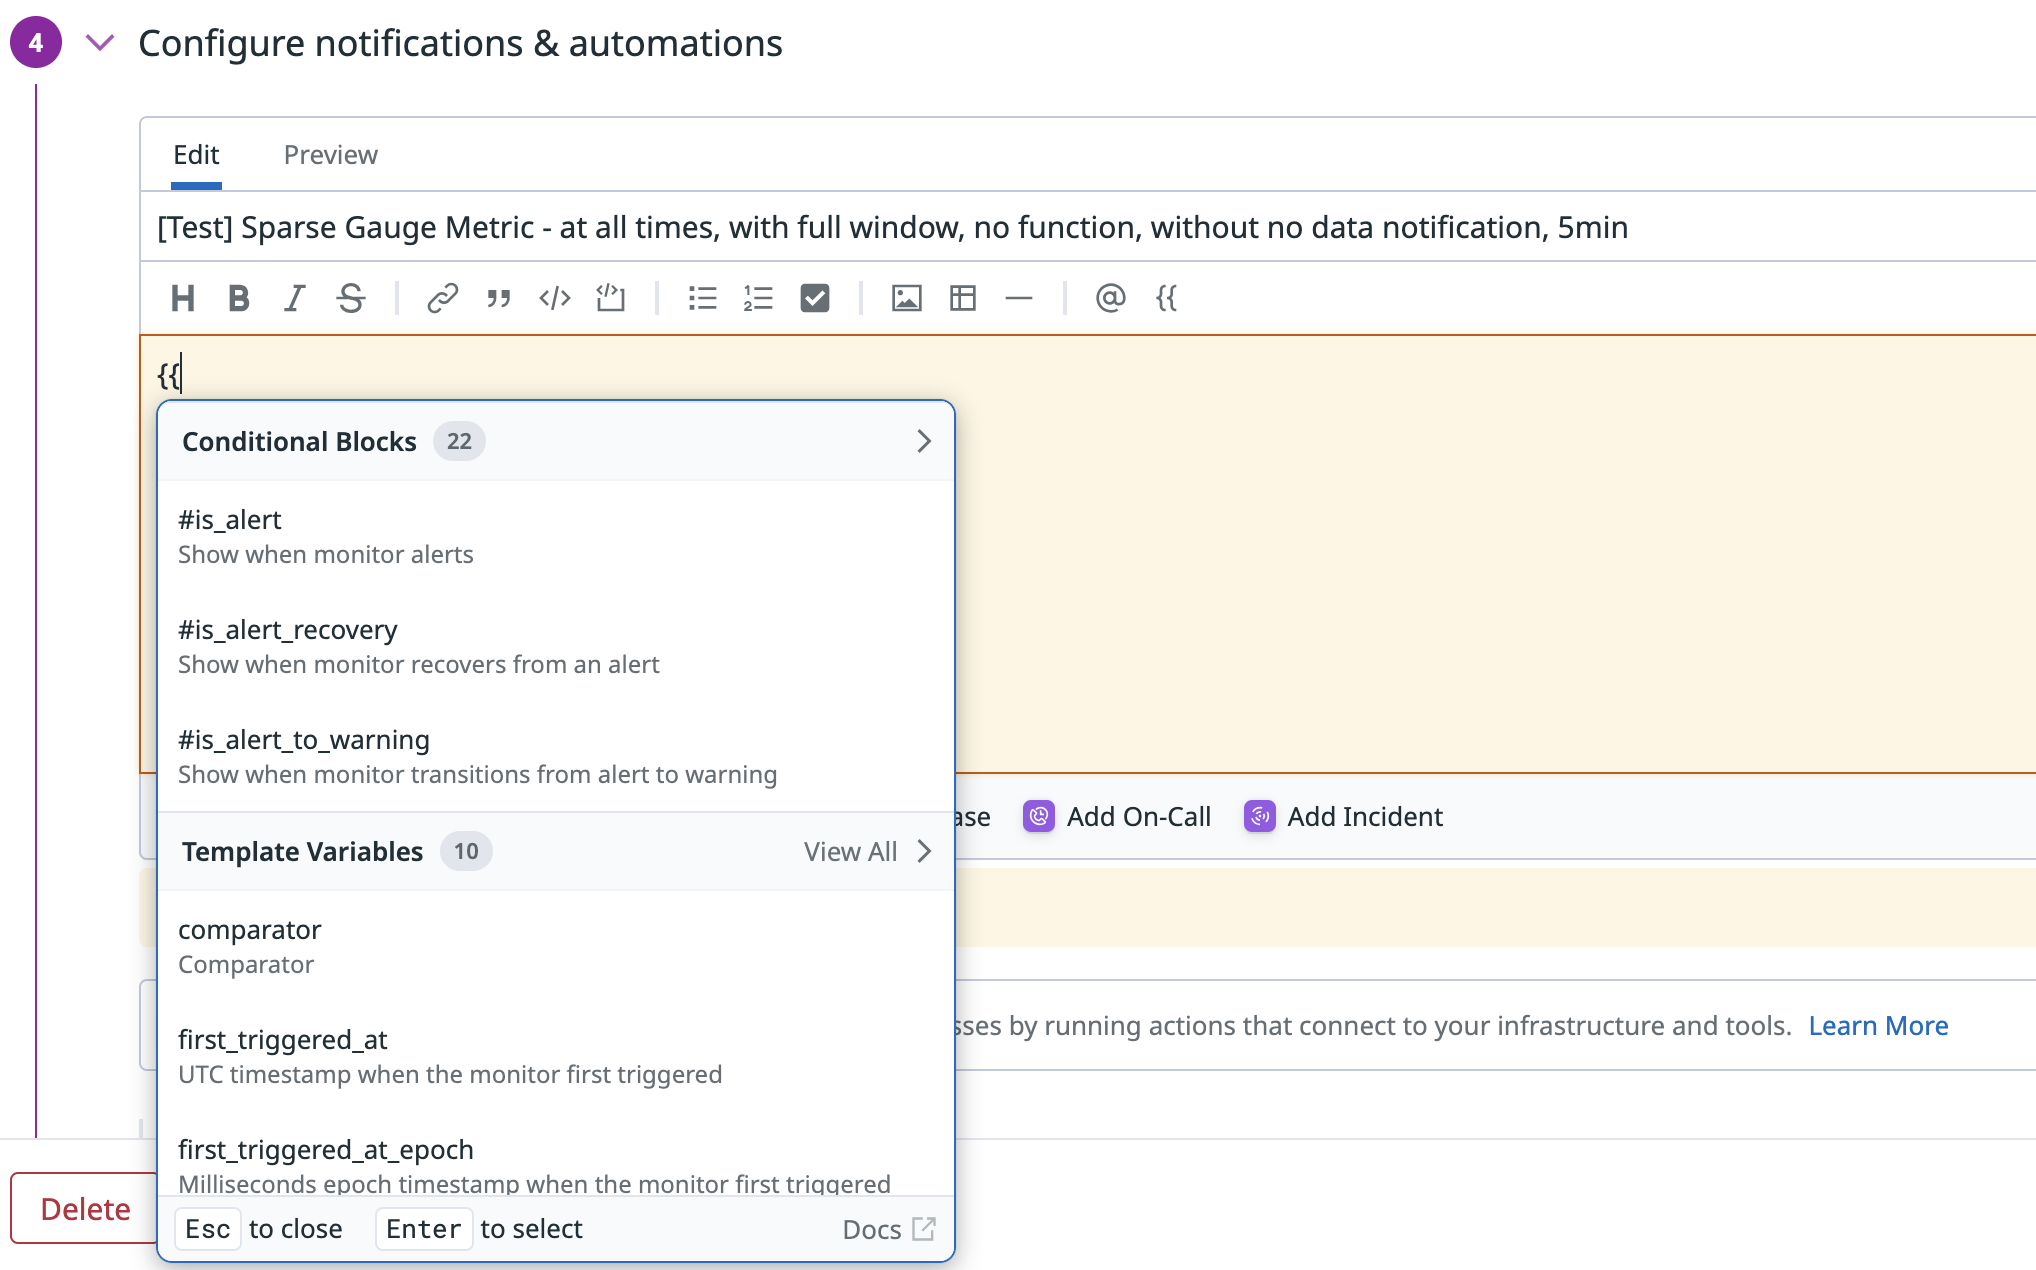
Datadog allows you to create dynamic alert messages using conditional logic and template variables. This enables you to customize notifications based on the alert status, tag values, or other contextual information.
Alert Status Conditions
Adapt your message content to reflect the current alert state using conditionals:
{{#is_alert}}for active alerts{{#is_warning}}for warnings{{#is_recovery}}for recovery/resolved notifications
This ensures alerts are not only accurate but also intuitive and actionable based on the situation.
{{#is_alert}}
🔴 CRITICAL: High CPU usage detected on {{host.name}}
Current: {{value}}% | Threshold: {{threshold}}%
{{/is_alert}}

{{#is_warning}}
🟠 WARNING: Elevated CPU usage on {{host.name}}
Current: {{value}}% | Threshold: {{threshold}}%
{{/is_warning}}

{{#is_recovery}}
🟢 RESOLVED: CPU usage has returned to normal on {{host.name}}
Current: {{value}}%
{{/is_recovery}}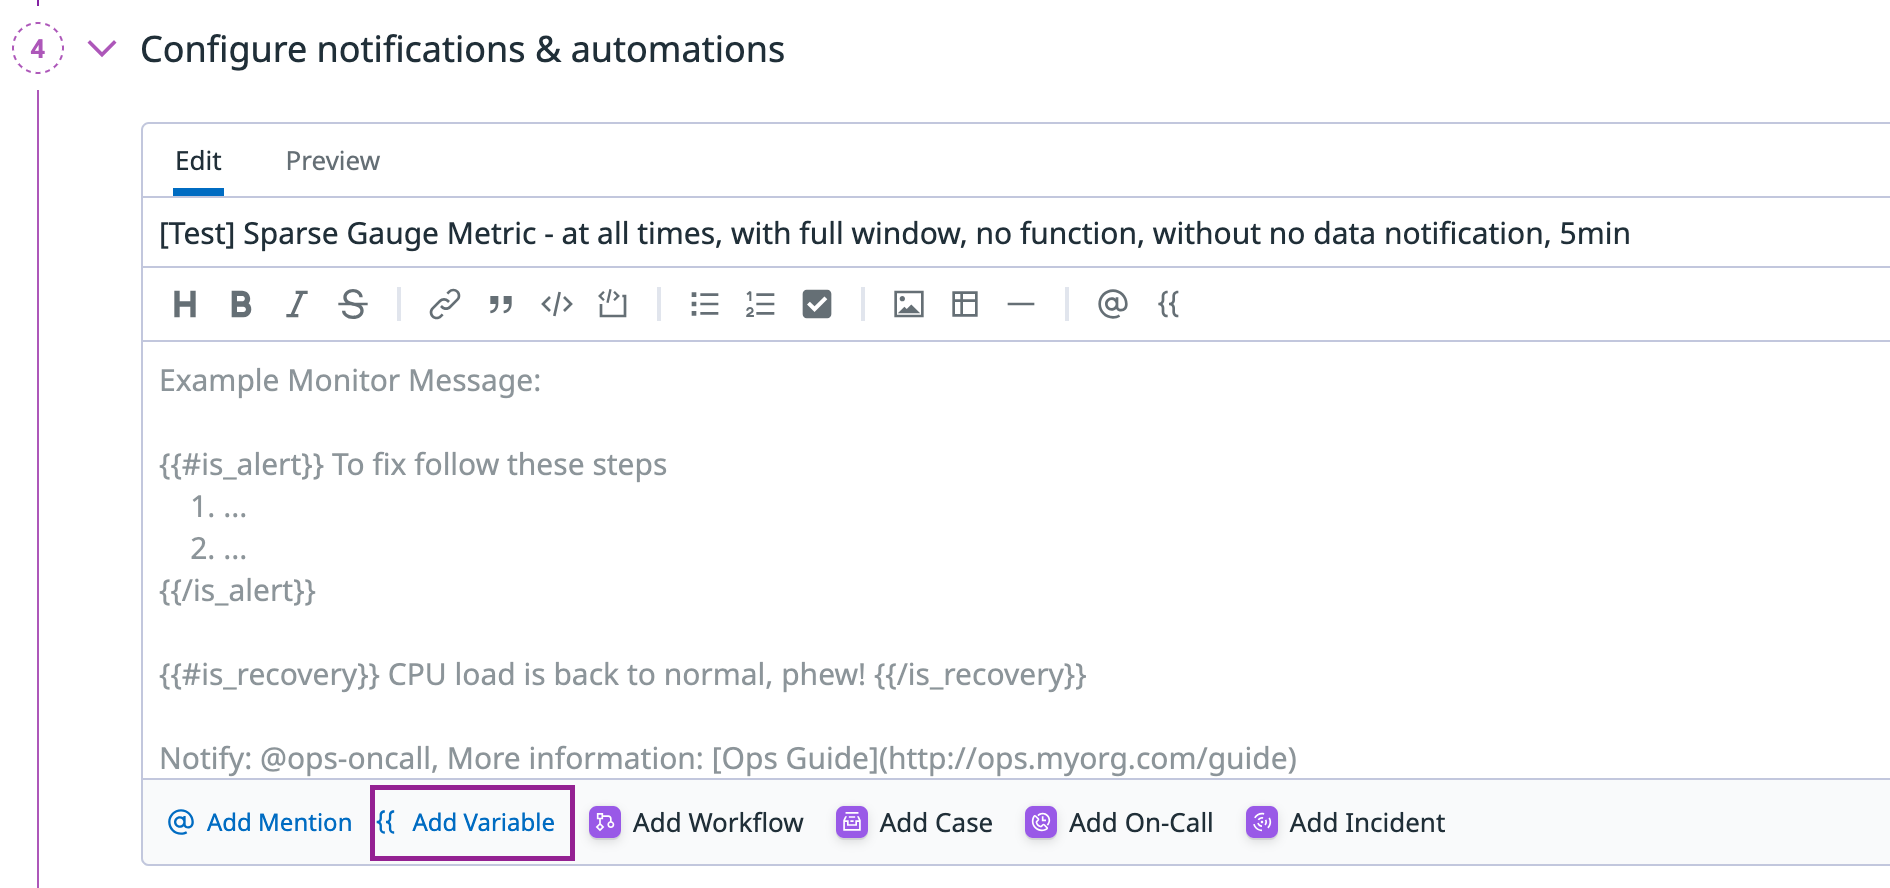
Tag-Based Conditions (advanced)
Use {{#is_match}} to customize alerts based on tag values, like environment or team.
Example: escalate immediately if env:prod, but route staging alerts to Slack only. This keeps your incident response targeted and appropriate to the context.
{{#is_alert}}
High error rate detected for {{service.name}}!

{{#is_match "env" "prod"}}
🚨 PRODUCTION ALERT - IMMEDIATE ACTION REQUIRED 🚨
@pagerduty-prod @slack-prod-alerts
{{/is_match}}

{{#is_match "env" "staging"}}
Staging environment issue - Please investigate
@slack-staging-alerts
{{/is_match}}

{{#is_match "env" "dev"}}
Development environment issue
@slack-dev-alerts
{{/is_match}}
{{/is_alert}}
Combining Multiple Conditions
Need complex logic? You can nest multiple conditional checks. For example, escalate alerts to the DB team only if:
- The issue occurs in production
- The affected host belongs to the “database” team
This enables highly specific routing, reducing noise for others and speeding up the right response.
{{#is_alert}}
Database latency issue detected!

{{#is_match "host.env" "prod"}}
  {{#is_match "host.team" "database"}}
  🚨 CRITICAL: DB Team, immediate action required for production database!
  @pagerduty-database-team @slack-database-alerts
  {{/is_match}}

  {{^is_match "host.team" "database"}}
  Alert: Production database issue affecting your service
  @slack-{{host.team}}-alerts
  {{/is_match}}
{{/is_match}}
{{/is_alert}}
Effective Monitor Tagging
Tags are the backbone of scalable monitoring. They enable:
- Efficient filtering
- Smart routing of alerts
- Cross-system correlation
When used consistently, tags make it easier to organize monitors, analyze patterns, and keep teams focused on what matters. We cover it in large in our previous article.
Monitor correlation
While monitors could be useful in isolation they are often tied to an application, a system and more. To unlock monitor correlation in Datadog, make sure to include at least:
env: The environment (e.g., prod, staging)service: The name of the application or component
Make sure to set those up to automatically connect your monitor to underlying services and benefit from enriched service map and multiple shortcuts in service pages.
This metadata enables Datadog to surface root causes, correlate alerts across systems, and improve Watchdog’s suggestions.
Ownership tags
Beyond the standard unified service tags, add a team tag to indicate ownership. It helps route alerts, filter dashboards, and streamline triage. Teams can focus on the monitors relevant to them—without wading through alerts they don’t own.
Want to go beyond? Use the team tag to route alert accordingly. Here is a quick demo.
Setting Priority Levels
Assign priority levels to your monitors to indicate their importance and guide response actions. Datadog uses string values like "low" or "normal" for priority, which can be mapped to numerical systems (P1-P5) in other platforms.
// For critical infrastructure monitors
Priority: P1 - Critical - Immediate action required

// For important but non-critical monitors
Priority: P3 - Normal - Investigate during business hours
Tag policies
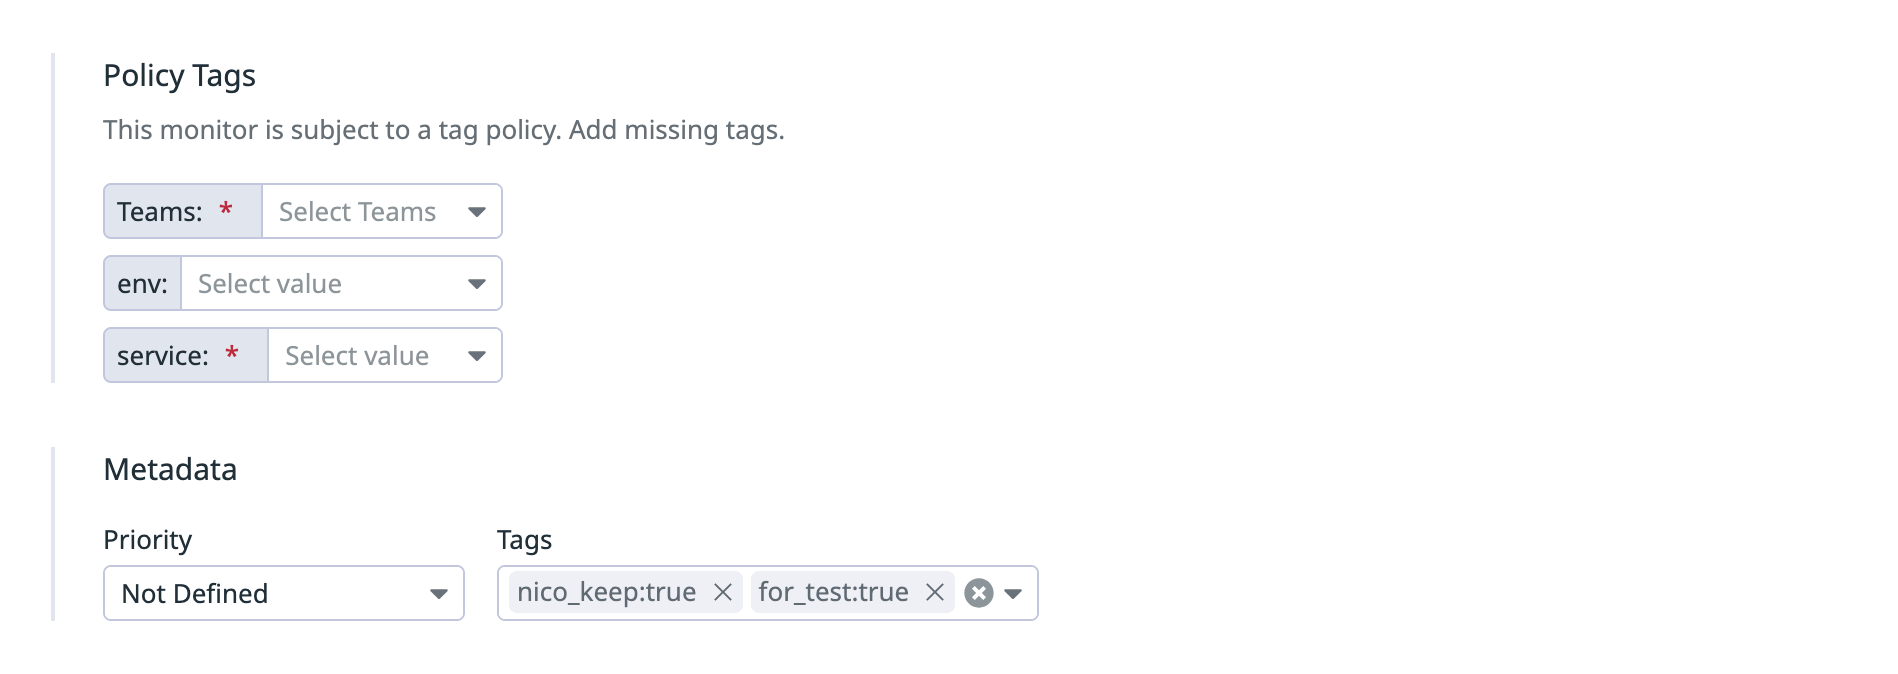
Now that you've a good understanding of what tags are important, note that Datadog provide a tagging policy for monitors. It allows you to enforce data validation on tags and tag values on your Datadog monitors. This ensures that alerts are sent to the correct downstream systems and workflows for triage and processing.
⚠️ Note: Once policies are active, existing monitors that don’t comply will be blocked from updates—plan accordingly in Terraform or CI/CD pipelines.

Advanced Monitor Techniques
As your monitoring needs grow more sophisticated, Datadog offers advanced features to handle complex scenarios.
Using Composite Monitors for Complex Scenarios
Composite monitors combine multiple individual monitors using logical operators (&&, ||, !) to create more nuanced alerting conditions. This helps reduce alert noise by triggering notifications only when multiple conditions are met.
For example, to alert on high error rates only when there are sufficient users:
// Monitor A: Error rate monitor
avg(last_5m):avg:application.error_rate{env:production} > 0.05

// Monitor B: User activity monitor
avg(last_5m):avg:application.user_count{env:production} > 100

// Composite Monitor: A && B
Trigger when both conditions are true
As another example, you might want to alert when queue length crosses a threshold BUT ONLY if the service has been running for more than 10 minutes, preventing false alarms during service restarts.
Using the Monitor Status Dashboard to Identify Noisy Monitors
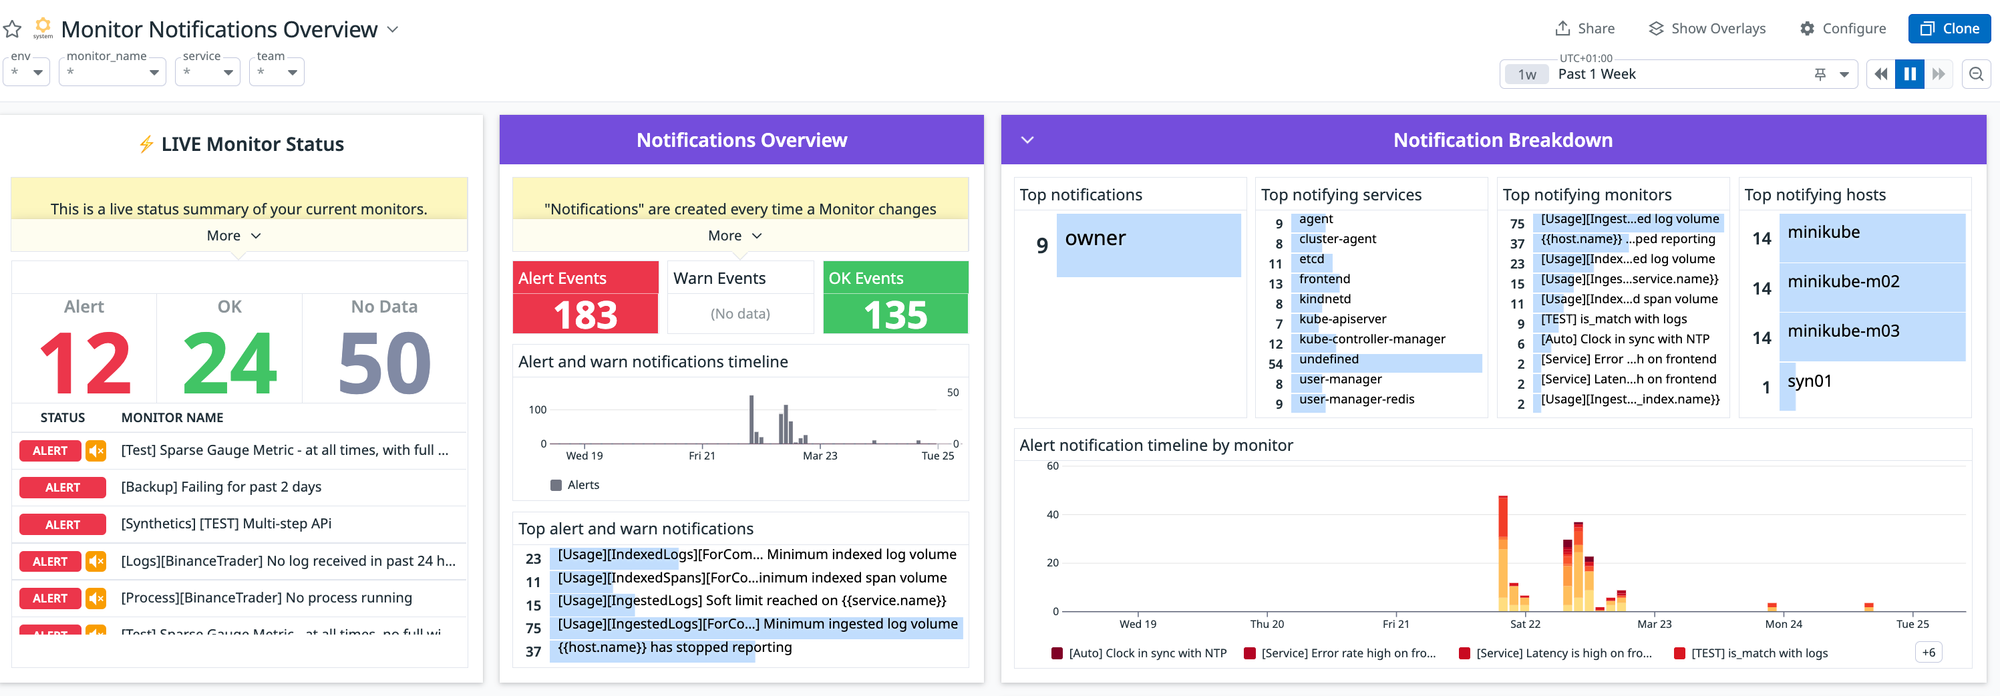
Datadog provides a Monitor Notifications Overview dashboard that helps identify monitors generating excessive alerts. Regularly review this dashboard to refine your monitoring strategy.
Look for:
- Monitors with high alert counts
- Monitors that frequently transition between states
- Monitors with long-running alerts
Use this information to adjust thresholds, evaluation periods, or composite conditions to reduce unnecessary noise.
✅ Quick Monitor Hygiene Checklist
Quick checklist:
- ✅ Evaluation window tuned to reduce noise
- 📝 Clear alert messages with runbooks
- 🏷️ Use standard tags:
env,service,team - 🔁 Review noisy monitors regularly
Conclusion: From Noise to Insight
Building a reliable and scalable monitoring system isn’t just about setting thresholds—it’s about creating clarity amid complexity. By focusing on symptom-based alerts, fine-tuning evaluation windows, handling edge cases like “no data” and delayed metrics, and crafting informative, actionable alert messages, you dramatically improve your team's ability to respond to real issues without drowning in noise.
Remember:
- Good alerts reduce fatigue and build trust in the system.
- Clear messages and runbooks shorten time to resolution.
- Tags and policies make alerts manageable at scale.
Whether you're just getting started with Datadog or refining an existing setup, these best practices will help you build a resilient, low-noise monitoring system your team can rely on—day or night.
👉 Next step: Review your most critical monitors and see which best practice you can apply today. Small tweaks can lead to big improvements.


