Datadog Monitor Analyzer

You’ve spent time learning how to configure great monitors in Datadog—from tagging correctly to reducing alert fatigue. But how do you know if your team is consistently applying those best practices?
Today, we’re launching a free Monitor Analyzer that does exactly that.
It instantly checks your Datadog monitors for key quality properties—so you can improve alert accuracy, reduce noise, and confirm you’re following the guidance shared in our blog post and video tutorial.
💡 Why Monitor Hygiene Matters
Datadog monitors are powerful, but they can quickly become a source of frustration if they’re misconfigured:
- Noisy alerts lead to fatigue and missed incidents
- Lack of tags makes it hard to correlate issues across systems
- Alerts without context or ownership slow down incident response
Cleaning up monitors manually takes time, especially across large environments. That’s why we built the Monitor Analyzer—a simple way to audit your monitor setup and catch common issues automatically.
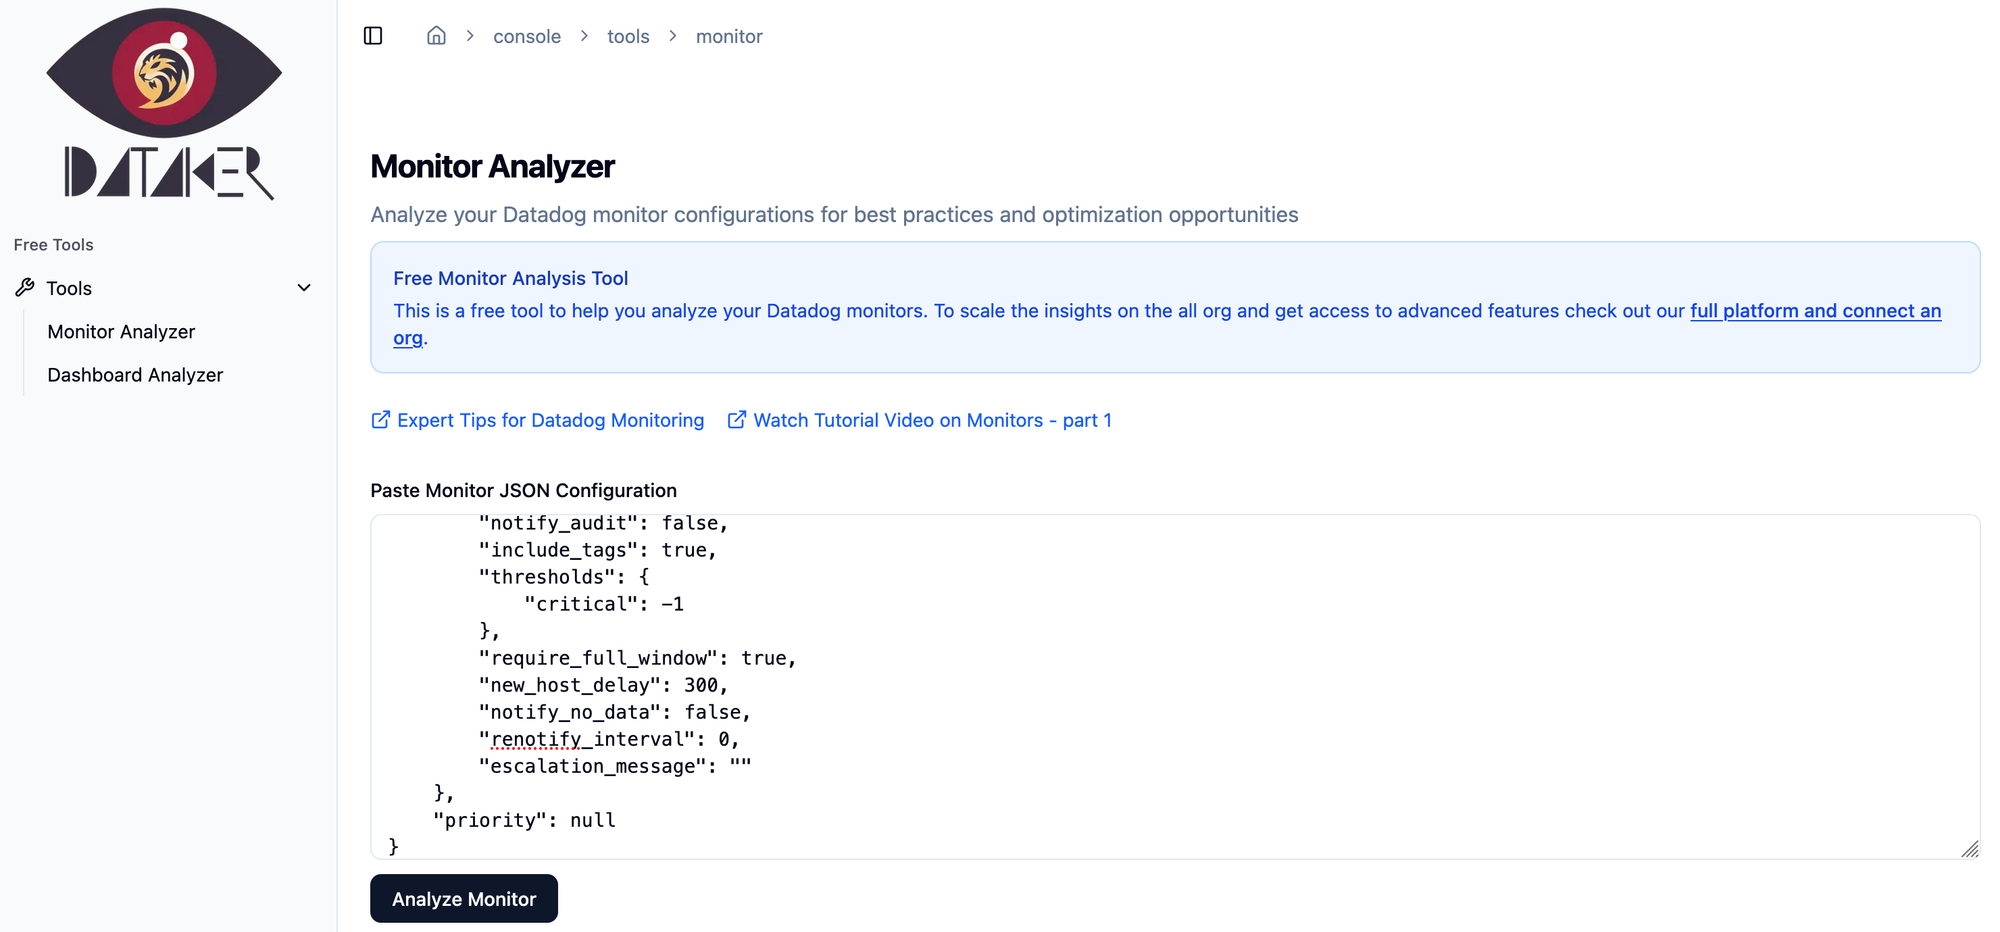
🚀 Introducing the Free Monitor Analyzer
The Monitor Analyzer scans your existing Datadog monitors and evaluates whether they’re aligned with recommended best practices.
- ✅ Instant audit across any monitor
- ✅ Validates tagging, alert configuration, message quality, and more
- ✅ Prioritizes what to fix first
- ✅ Totally free to use
Think of it as your monitoring checklist—automated. Whether you’re onboarding a new team or reviewing legacy alerts, this tool helps you raise the quality bar with minimal effort.
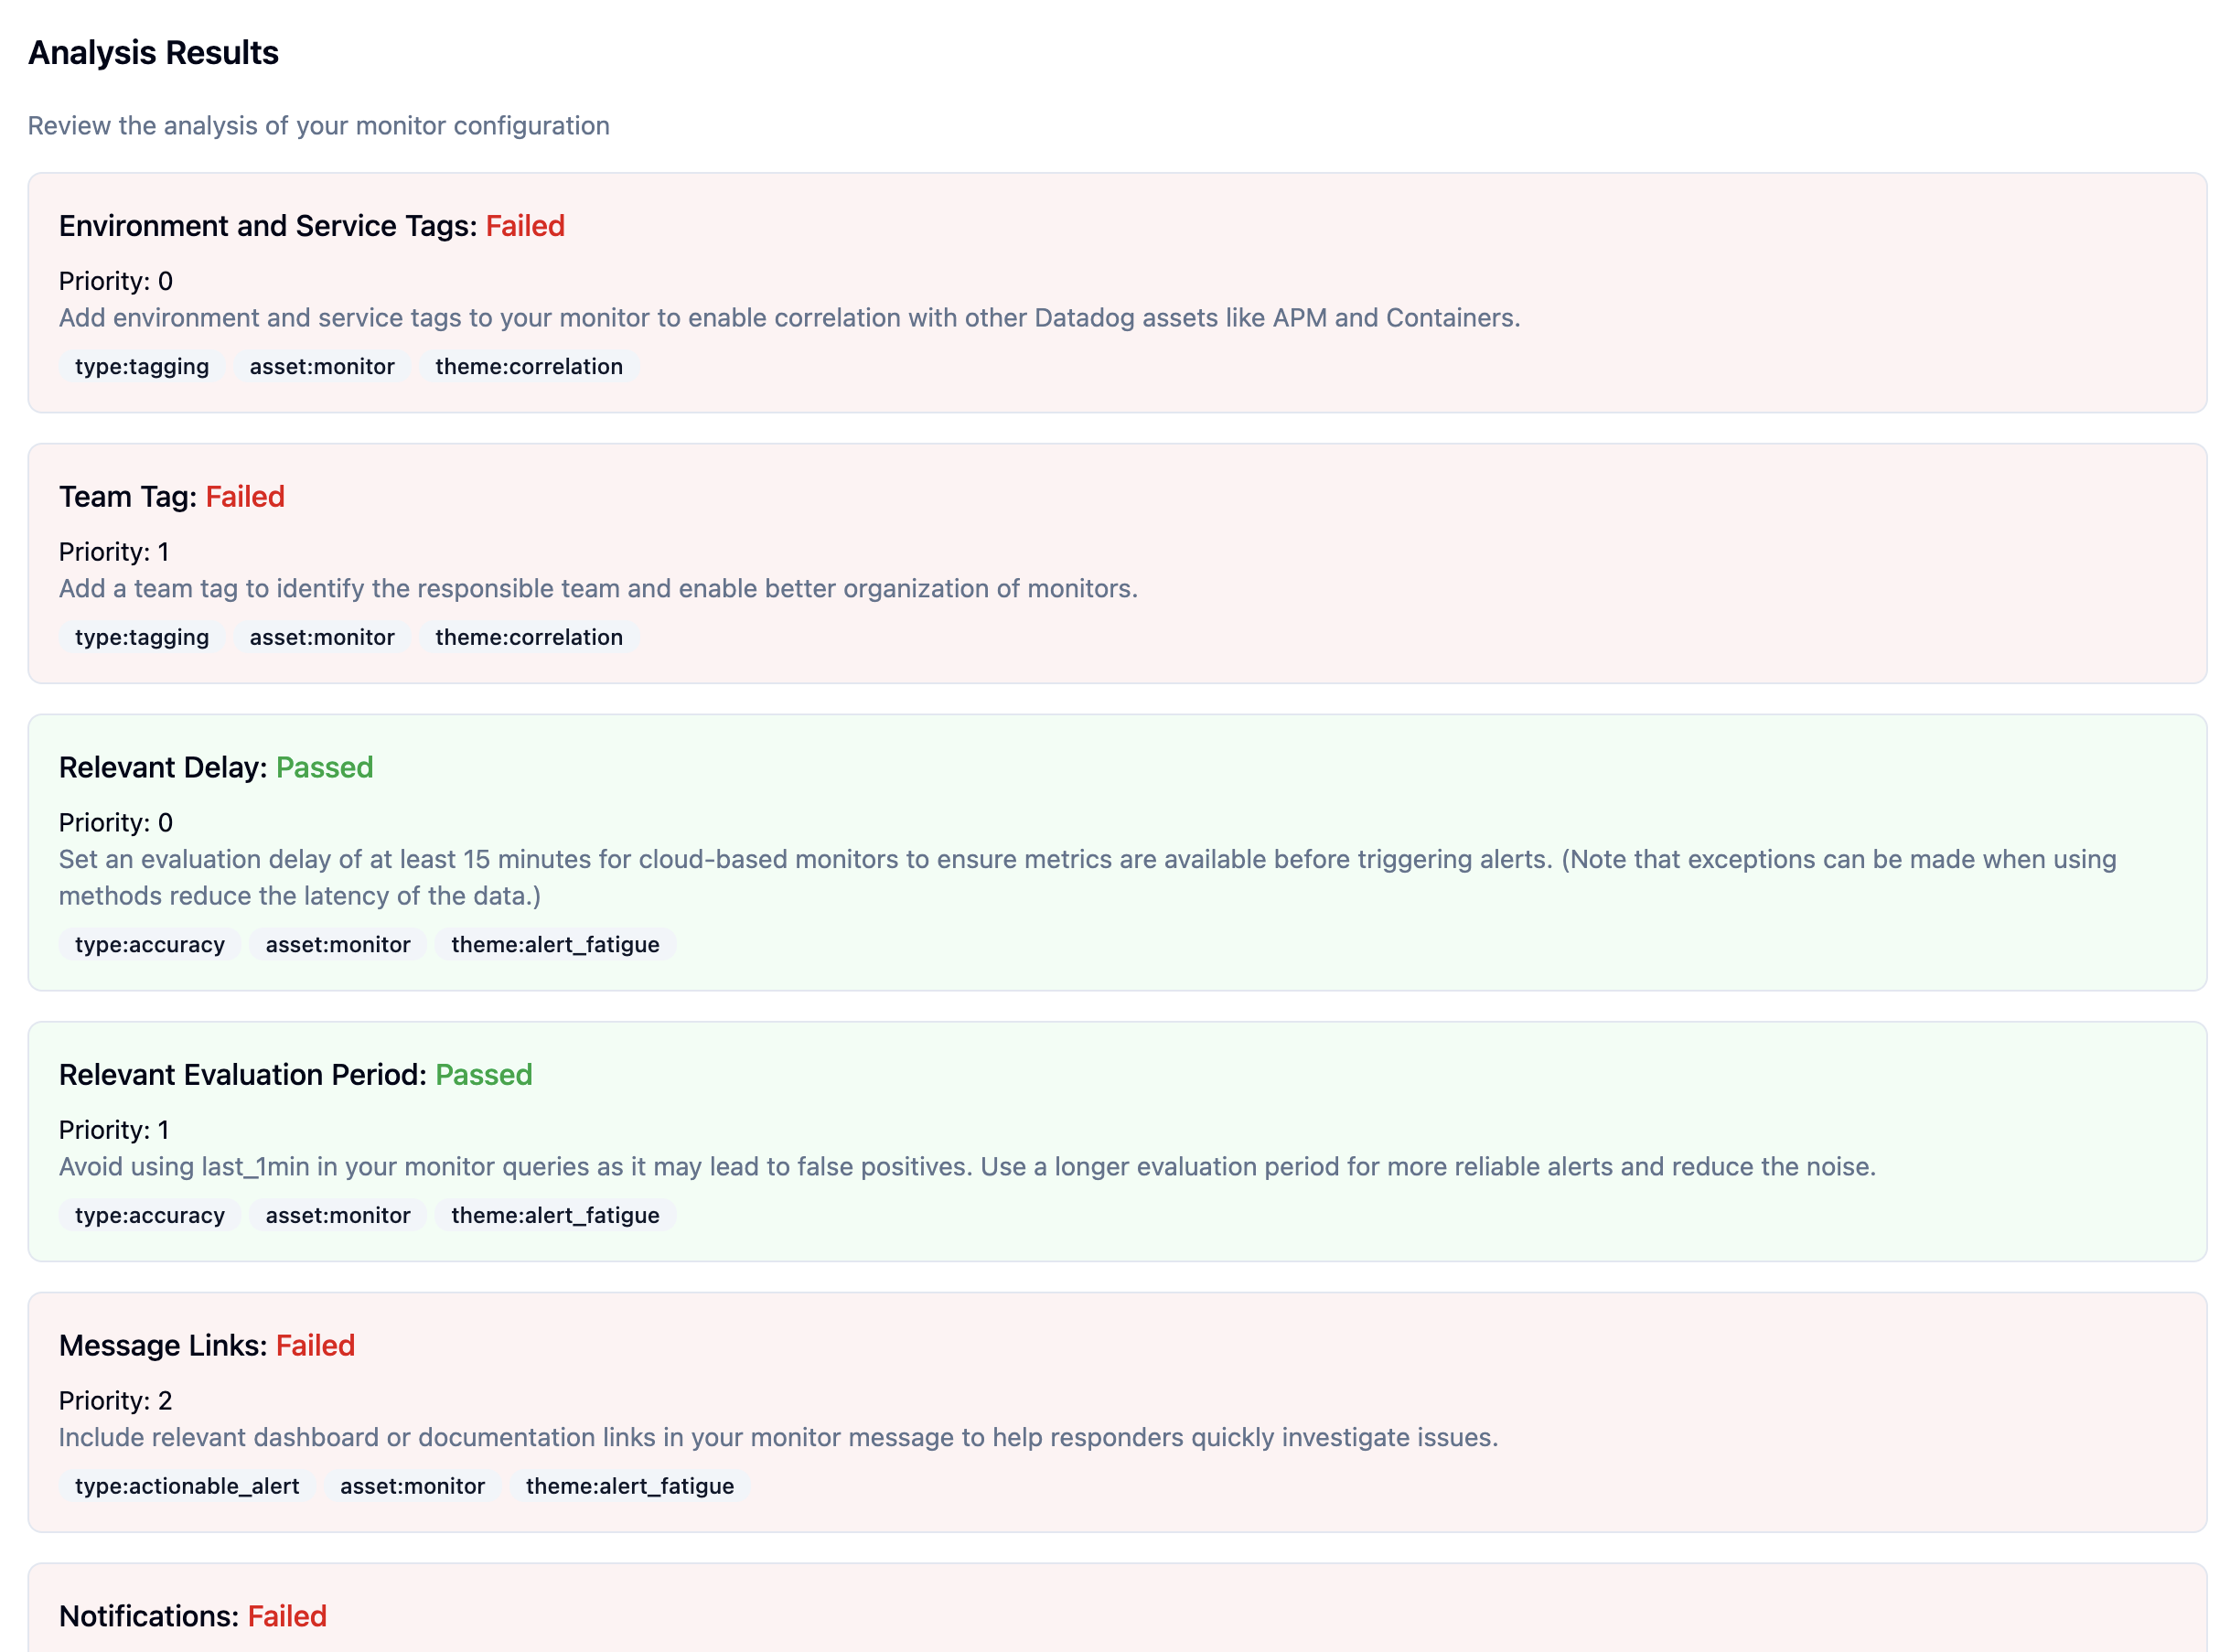
🛠️ What We Check For
Here’s what the analyzer looks for—and why it matters:
🏷️ Correlation Through Tags
- Environment & Service Tags – Verifies that monitors include environment and service tags to enable correlation with APM traces, logs, containers, and dashboards.
- Team Tag – Ensures that a team tag is present to establish ownership and improve monitor organization.
⏱️ Alert Accuracy & Fatigue Reduction
- Relevant Delay – Checks that an evaluation delay of at least 15 minutes is set for cloud-based monitors to prevent false positives due to delayed metrics.
- Evaluation Period – Validates that short windows like last_1min are avoided in favor of longer periods that reduce alert noise.
📬 Actionable Alerts
- Message Links – Confirms that alerts include links to dashboards or documentation to speed up investigation.
- Notifications – Ensures that @mentions are used to notify the right team members when alerts trigger.
- Action Items – Verifies that alert messages contain clear next steps or links to playbooks to support faster resolution.
⚙️ How to Use the Analyzer
Getting started is simple:
- Go to your monitor in Datadog
- Export the monitor
- Copy the JSON output
- Paste in the analyzer
- Run the analyzer
- Get a pass/fail report for each rule
- Review what passed, what didn’t, and why
You’ll also get prioritization hints—so you know where to focus first.
Pro tip: Run the large scale analyzer as part of your weekly ops review or post-incident retros.
🎯 What’s In It for You
This analyzer helps you:
- Cut down on alert fatigue by spotting noisy configurations
- Improve incident response with better alert context
- Enforce best practices automatically
- Validate what your team has learned from our previous content
And because it’s free, there’s no reason not to give it a try.
👉 Ready to Try It?
Run the Monitor Analyzer now and see how your monitors stack up.
Or revisit our blog post and video to understand the “why” behind each rule.
If you’d like help auditing your whole environment or rolling out tagging strategies at scale, reach out to our team.