Correlation the foundation of good Observability

Why Data Correlation Matters in Crisis Management
In times of crisis, your ability to quickly connect the dots between various data points can be the difference between identifying a root cause swiftly or getting lost in an overwhelming sea of metrics. When investigating an incident, such as a CPU spike, it’s not enough to look at CPU usage in isolation. You also need to understand its relationship with memory usage, disk I/O, running processes, or recent changes. This interconnectedness is the foundation of a well-designed monitoring system that supports seamless, efficient investigations.
Moreover, correlating different metrics offers valuable insights into your system's behavior. For instance, you might discover that CPU spikes occur at specific times of the day or that disk I/O increases when certain applications run. By understanding these relationships, you can uncover patterns that inform better decision-making, whether it’s about improving reliability or deciding on new features. In the long term, this data correlation leads to smarter, data-driven decisions.

How to Correlate Data for Deeper Insights
To correlate data effectively within your monitoring system, there are several key strategies you can use:
- Dashboards: Visualize multiple metrics at once to spot trends and outliers.
- Tags and Labels: Group related data and systems together for easier correlation.
Datadog’s tagging system is especially powerful in this regard. By tagging hosts, services, and metrics with selected labels, you can easily organize and group related data. This allows you to create dashboards that display multiple metrics side-by-side and set up alerting rules that trigger based on specific correlations. Datadog even goes further with Watchdog and analyze correlated signals to understand the relationship between events.
However, even though some correlations are done natively due to the nature of the data collected, not everything is linked to each other. So let's explore some of the most common setups to improve your correlation.

Monitor Tagging and Correlation in Datadog
By applying service and env (for environment) tags to your monitors, Datadog can link an APM service with its corresponding monitor. This connection makes it easy to track the status of your services directly from a service page, service map, or related elements. You can immediately assess the impact of an issue on a particular service or environment, making your response more targeted and efficient.
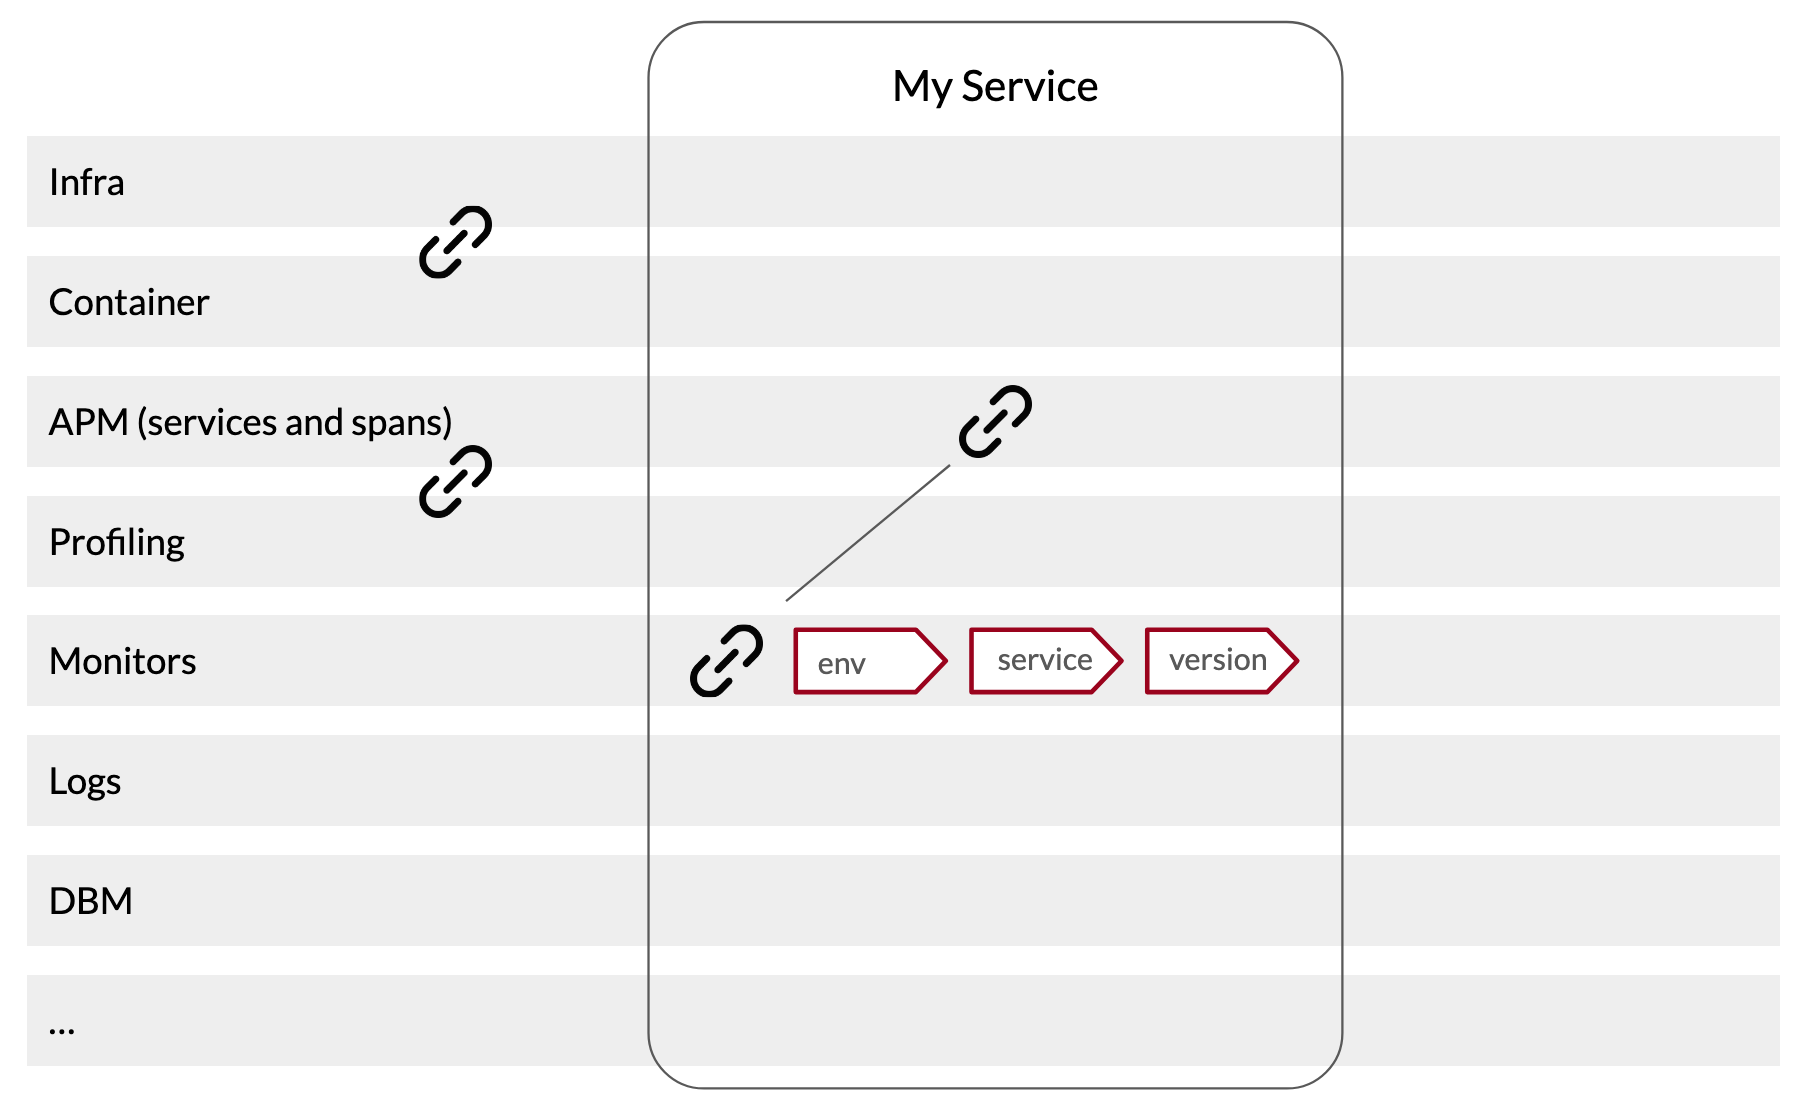
A key benefit of such tagging is that when all services are appropriately tagged, you can visualize the scope of an incident on the service map. This allows you to see which services are in a critical state, helping you quickly understand the severity and extent of the issue.

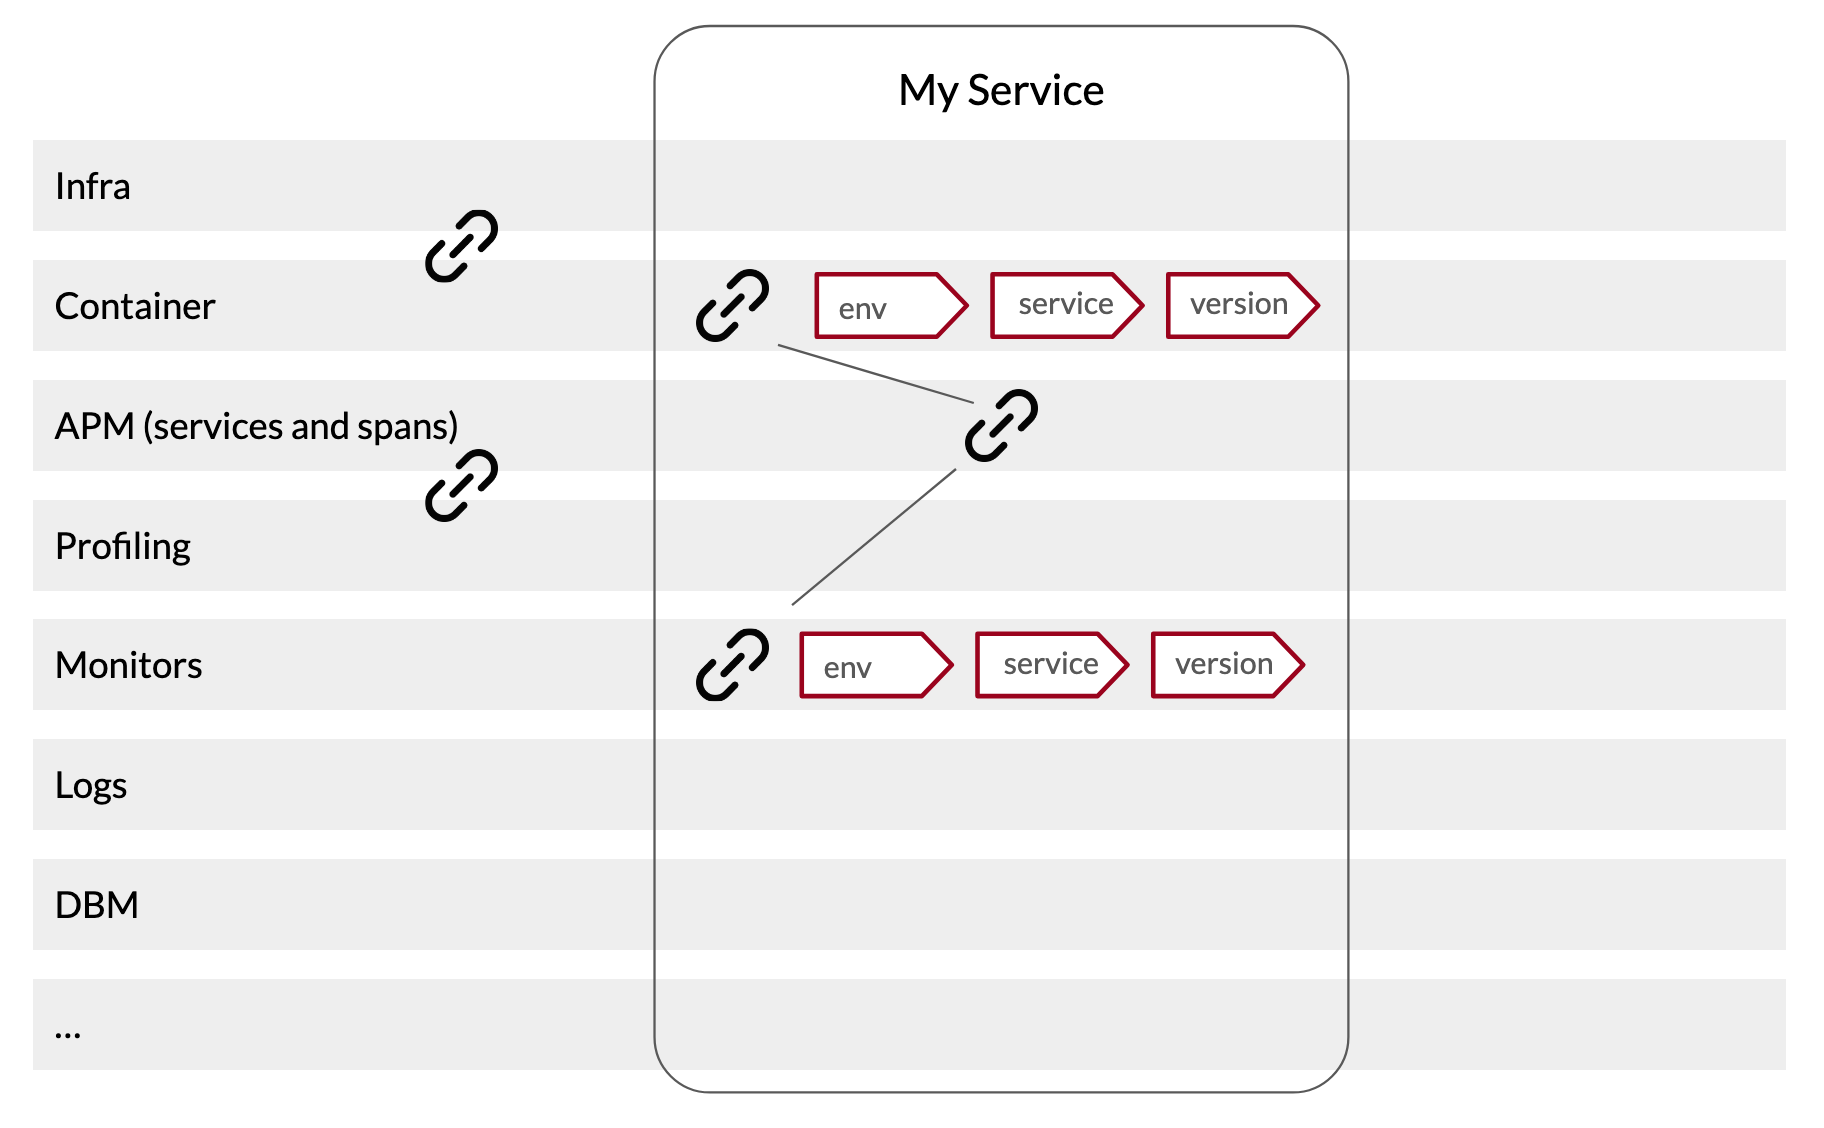
Container Tagging and Correlation
Datadog’s Unified Service Tagging enables you to tag containers with important labels like env, service, and version. This tagging creates automatic associations between containers and their respective services, environments, and versions. Such correlation is invaluable when investigating issues, as you can easily navigate between a container and its related service.
Container tagging also plays a critical role in achieving end-to-end monitoring. By linking infrastructure data from a container with its corresponding service, you gain a comprehensive view of system performance. For example, you might find that a newly deployed service version impacts the underlying infrastructure or causes issues with other containers. Conversely, an infrastructure issue might negatively affect the performance of a service. With container tagging, these relationships can be quickly identified and addressed.
Log tagging and correlation
Logs are essential when diagnosing issues in your system. By correlating logs with other metrics, such as container data or APM metrics, you can gain a more holistic understanding of the problem. For instance, if you notice an abnormal metric from a container, checking its logs can help you uncover the underlying cause.

Datadog makes this correlation seamless with its Agent. For developers, correlating APM metrics and spans to logs provides even deeper insights. If a spike in 500 status codes occurs, for example, checking the APM spans can help you understand the impact on dependent services. But don’t forget the logs—they might contain additional context or errors that could be crucial in identifying the root cause.
Configuration Example for App Logs:
init_config:

instances:

##Log section
logs:

  - type: file
    path: "<FILE_NAME_PATH>.log"
    service: <SERVICE_NAME>
    source: nodejs
    sourcecategory: sourcecode
Configuration Example for Container Logs:
apiVersion: v1
kind: Pod
# (...)
metadata:
  name: '<POD_NAME>'
  annotations:
    ad.datadoghq.com/<CONTAINER_NAME>.logs: '[<LOG_CONFIG>]'
    # (...)
spec:
  containers:
    - name: '<CONTAINER_NAME>'
# (...)
For more details on log configuration, check out the full Datadog documentation: Datadog Container Logs.

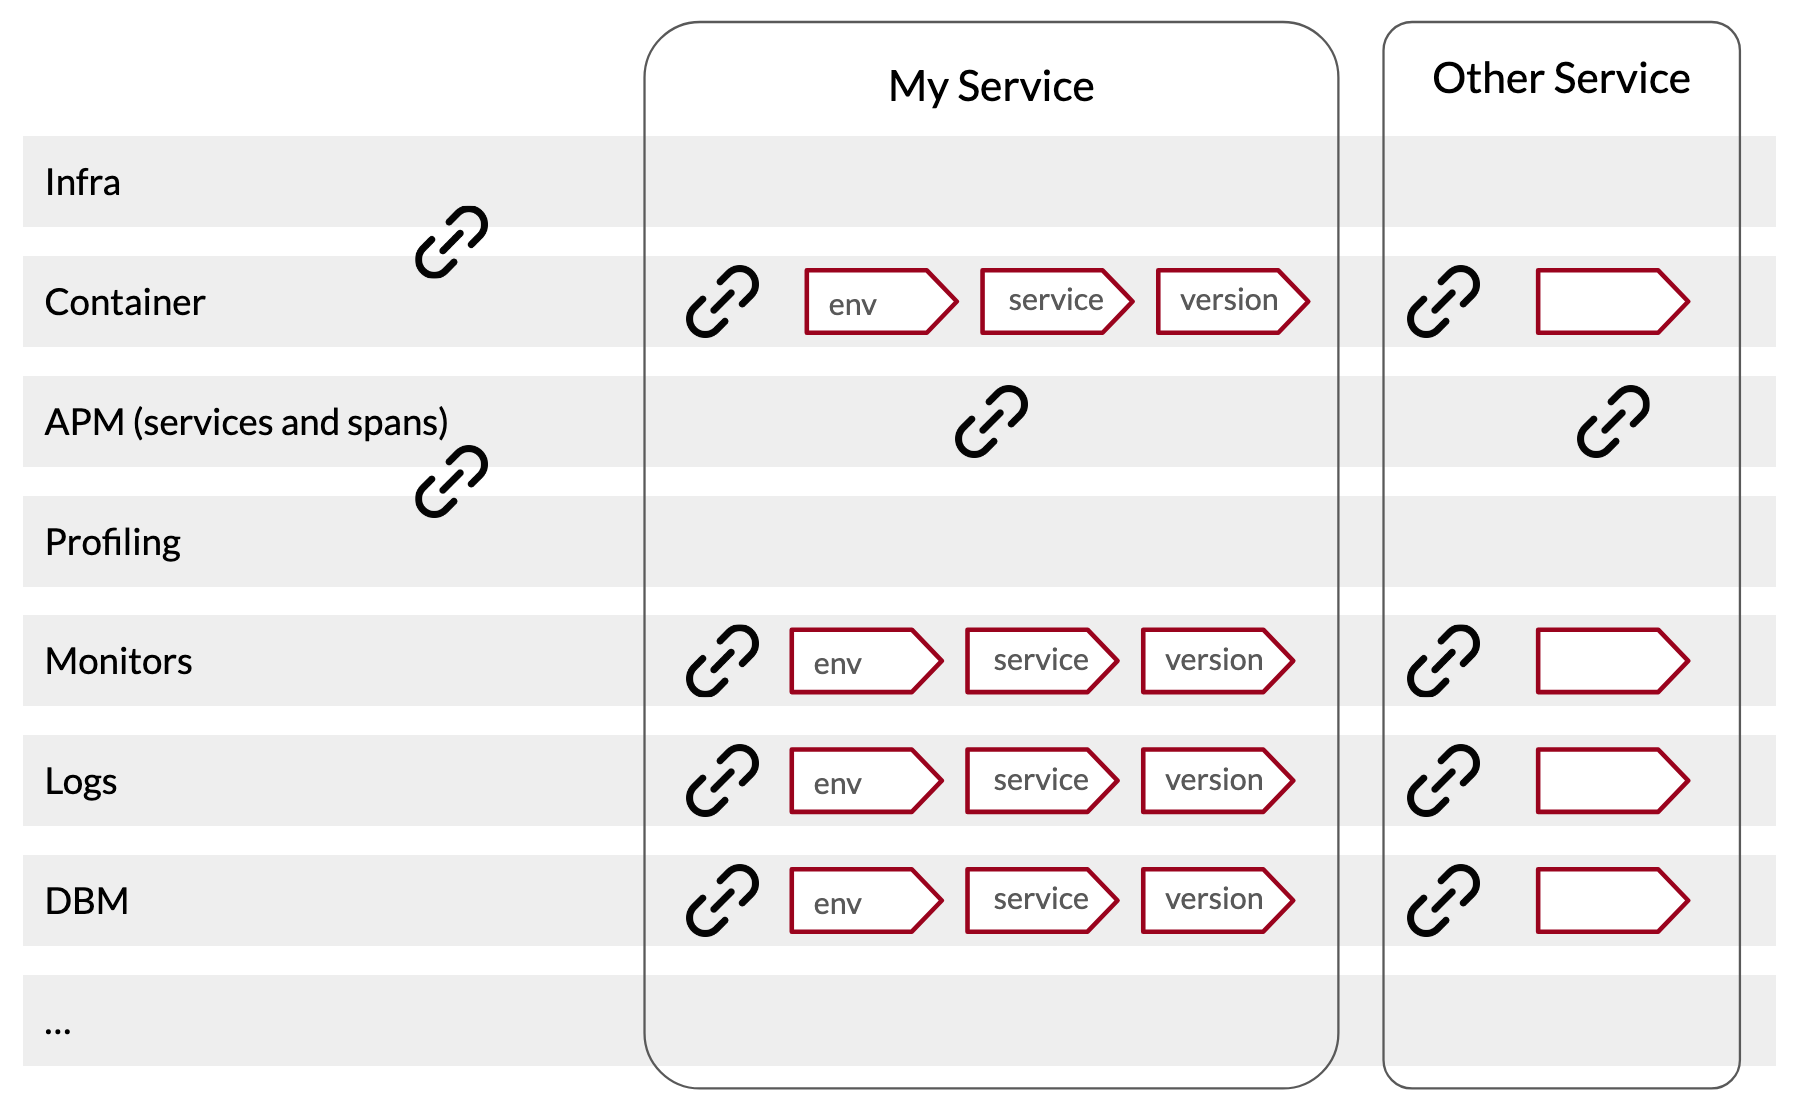
More APM data correlation
This article isn’t intended to cover every possible correlation available through an APM service. Instead, it highlights that most correlations rely on just three key tags: env, service, and version. For any products not discussed here—like Synthetics, DBM, and others—be sure to apply these tags to enjoy similar native integration and enhanced platform benefits.
Host Tagging and Correlation
Tagging hosts properly is fundamental for effective monitoring. The process is simple—just tag the host with the env tag, and Datadog will propagate this tag to all containers, APM services, and integrations running on the host. This ensures that all layers of your system are connected, giving you a comprehensive view of performance and issues.
Conclusion
By effectively applying tagging and correlation strategies, you can build a robust monitoring system that helps you quickly understand the relationships between different metrics, services, and infrastructure. Whether you're investigating an incident or making long-term decisions about your system, data correlation provides the insights necessary to act fast and make informed choices. With Datadog's powerful tagging system, monitoring your services and infrastructure has never been more efficient.
Ready to take control of your Datadog data and optimize your system’s performance? Subscribe to app.dataiker.com and let Dataiker guide you step by step in identifying the root causes of issues. With our advanced data correlation, you’ll know exactly which area and team to focus on first, helping you make informed decisions that drive improvements across your system. Start using Dataiker today to unlock a clearer path to better performance!


![[Youtube] Mastering Synthetic Monitoring with Datadog: A Practical Guide](https://images.unsplash.com/photo-1460925895917-afdab827c52f?crop=entropy&cs=tinysrgb&fit=max&fm=jpg&ixid=M3wxMTc3M3wwfDF8c2VhcmNofDJ8fHdlYnxlbnwwfHx8fDE3NTM4MjMzMjh8MA&ixlib=rb-4.1.0&q=80&w=600)