

Debug Your OpenTelemetry Collector Locally Before You Blame the Backend
By Nicolas Narbais
Stop guessing where telemetry disappeared. Run the OpenTelemetry Collector locally with Docker Compose, send traces, metrics, and logs through it, and verify both pipeline telemetry and Collector self-metrics.
Introduction
When telemetry disappears, blaming the backend first is debugging from the wrong end.
The backend might be broken. But before you go there, prove the telemetry made it through the first hops.
The trace may never have reached the Collector. The metric may have entered the wrong pipeline. The log may have been received correctly but exported nowhere useful. Or the Collector may be fine while Prometheus is scraping the wrong endpoint.
This local lab gives you an OpenTelemetry Collector setup with Docker Compose. You will generate traces, metrics, and logs, send them through the Collector, and verify each signal before a real backend is involved.
The setup uses Prometheus, Jaeger, and the Collector debug exporter. No Grafana. No vendor exporter. No production-only complexity in the main path.
Observe The Observer
The Collector’s
/metricsendpoint describes the Collector itself. It is not the same thing as the application metrics flowing through the Collector pipelines.
That distinction matters because you are debugging two different things:
- Is my test telemetry flowing through the Collector?
- Is the Collector itself receiving, processing, exporting, or dropping telemetry?
In this lab, Prometheus scrapes both kinds of metrics, but from different endpoints.
If you only remember one sentence: prove the Collector path locally before you debug the backend.
What This Local Lab Proves
This stack gives you four things:
- one OTLP entry point: the Collector
- one raw inspection point: the
debugexporter - one trace UI: Jaeger
- one metrics UI: Prometheus
The shape matters more than the tools.
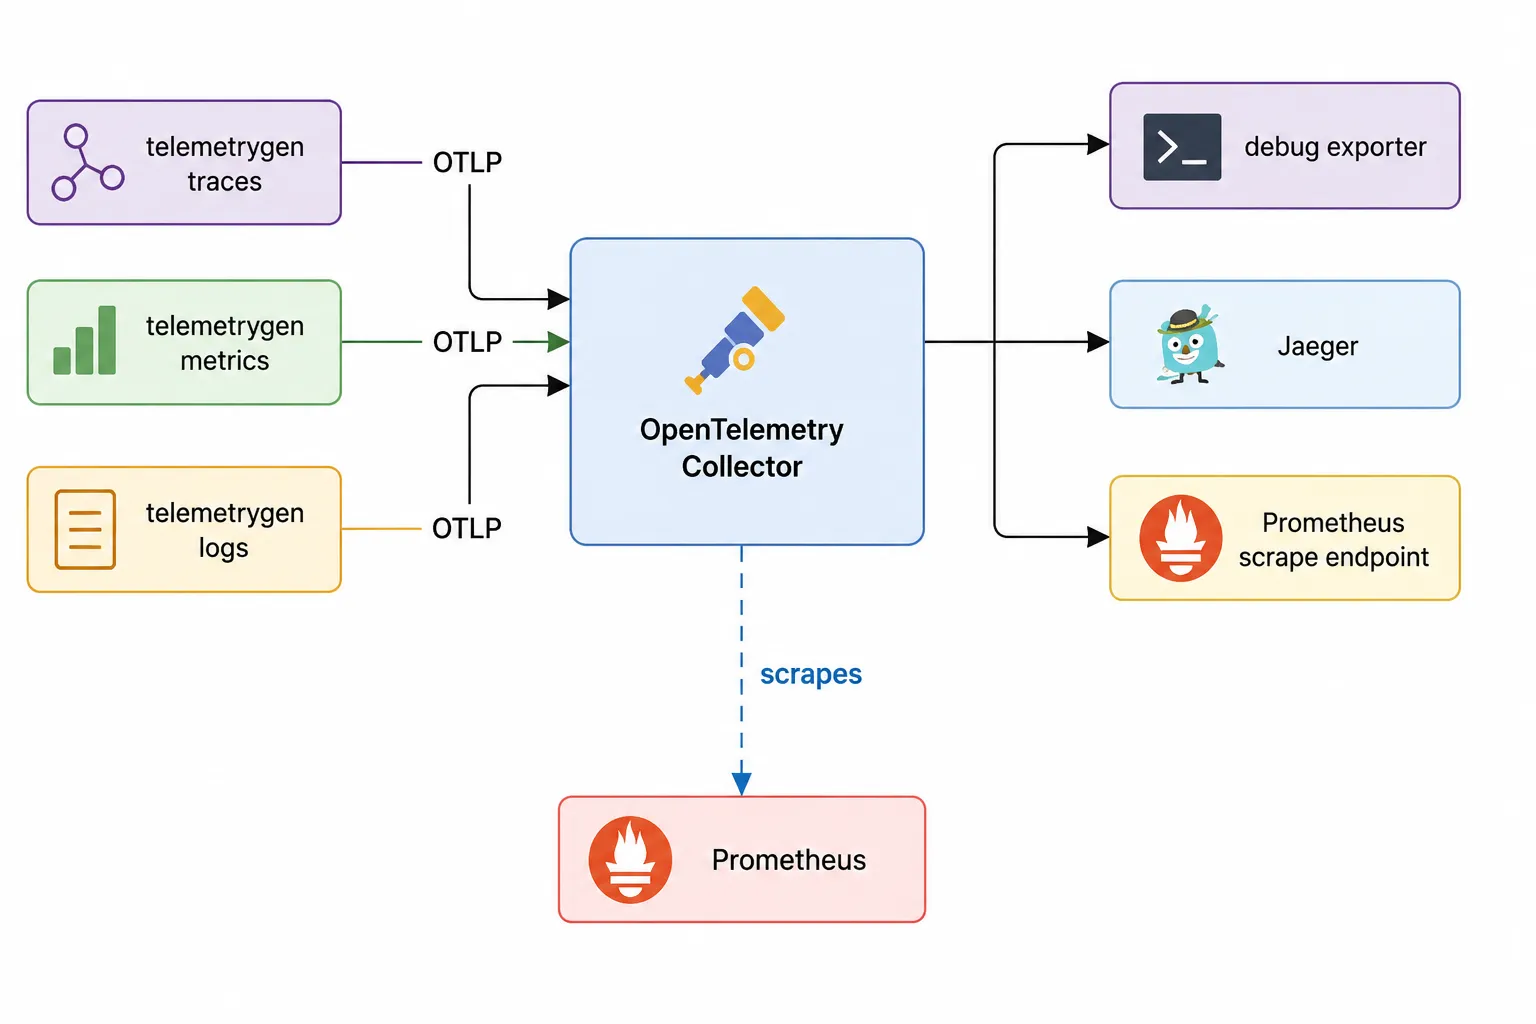
Files You Will Create
You need Docker and Docker Compose.
Create an empty directory and add three files:
docker-compose.yml
otelcol-config.yml
prometheus-config.yaml
Version note: the examples below use pinned image tags so the demo does not silently change under you. These versions were checked on May 30, 2026, ahead of publication. If something breaks later, check the relevant release notes for renamed metrics, config changes, or moved images.
The Docker Compose File
The Compose file starts the Collector, Prometheus, and Jaeger. It also defines three telemetry generators that you run on demand.
Create docker-compose.yml:
services:
  otel-collector:
    image: ghcr.io/open-telemetry/opentelemetry-collector-releases/opentelemetry-collector-contrib:0.153.0
    command: ["--config=/etc/otelcol-contrib/config.yaml"]
    volumes:
      - ./otelcol-config.yml:/etc/otelcol-contrib/config.yaml:ro
    ports:
      - "4317:4317" # OTLP gRPC receiver
      - "4318:4318" # OTLP HTTP receiver
      - "8888:8888" # Collector self-metrics
      - "8889:8889" # Metrics exposed by the prometheus exporter
    depends_on:
      - jaeger

  prometheus:
    image: prom/prometheus:v3.5.3
    command:
      - "--config.file=/etc/prometheus/prometheus.yml"
    volumes:
      - ./prometheus-config.yaml:/etc/prometheus/prometheus.yml:ro
    ports:
      - "9090:9090"
    depends_on:
      - otel-collector

  jaeger:
    image: jaegertracing/all-in-one:1.76.0
    environment:
      COLLECTOR_OTLP_ENABLED: "true"
    ports:
      - "16686:16686" # Jaeger UI
    # Jaeger's OTLP ports stay inside the Compose network.
    # The host only talks to the Collector on 4317 and 4318.

  telemetrygen-traces:
    image: ghcr.io/open-telemetry/opentelemetry-collector-contrib/telemetrygen:v0.153.0
    profiles: ["generate"]
    command:
      - traces
      - "--otlp-endpoint=otel-collector:4317"
      - "--otlp-insecure"
      - "--duration=30s"
      - "--rate=2"
    depends_on:
      - otel-collector

  telemetrygen-metrics:
    image: ghcr.io/open-telemetry/opentelemetry-collector-contrib/telemetrygen:v0.153.0
    profiles: ["generate"]
    command:
      - metrics
      - "--otlp-endpoint=otel-collector:4317"
      - "--otlp-insecure"
      - "--duration=30s"
      - "--rate=1"
    depends_on:
      - otel-collector

  telemetrygen-logs:
    image: ghcr.io/open-telemetry/opentelemetry-collector-contrib/telemetrygen:v0.153.0
    profiles: ["generate"]
    command:
      - logs
      - "--otlp-endpoint=otel-collector:4317"
      - "--otlp-insecure"
      - "--duration=30s"
      - "--rate=2"
    depends_on:
      - otel-collector
The telemetrygen services are behind a Compose profile. They do not run every time you start the stack. You run them when you want fresh telemetry.
Jaeger also accepts OTLP on 4317 and 4318 when OTLP ingestion is enabled (Jaeger deployment docs). In this Compose file, those Jaeger ports stay inside the Compose network. The host only talks to the Collector on 4317 and 4318.
The Collector Configuration
This config receives OTLP, prints every signal with debug, sends traces to Jaeger, and exposes pipeline metrics for Prometheus.
Create otelcol-config.yml:
receivers:
  otlp:
    protocols:
      grpc:
        endpoint: 0.0.0.0:4317
      http:
        endpoint: 0.0.0.0:4318

processors:
  memory_limiter:
    check_interval: 1s
    limit_mib: 256
    spike_limit_mib: 64

  batch:

exporters:
  debug:
    verbosity: normal

  otlp/jaeger:
    endpoint: jaeger:4317
    tls:
      insecure: true

  prometheus:
    endpoint: 0.0.0.0:8889
    resource_to_telemetry_conversion:
      enabled: true

service:
  telemetry:
    metrics:
      level: normal
      readers:
        - pull:
            exporter:
              prometheus:
                host: 0.0.0.0
                port: 8888

  pipelines:
    traces:
      receivers: [otlp]
      processors: [memory_limiter, batch]
      exporters: [debug, otlp/jaeger]

    metrics:
      receivers: [otlp]
      processors: [memory_limiter, batch]
      exporters: [debug, prometheus]

    logs:
      receivers: [otlp]
      processors: [memory_limiter, batch]
      exporters: [debug]
The Collector does not activate a component just because you defined it. A receiver, processor, or exporter only runs when it is attached to a pipeline in the service section (Collector configuration).
The config has one pipeline per signal. Keep that shape while you are debugging. It makes a broken path easier to see.
The Prometheus Configuration
Create prometheus-config.yaml:
global:
  scrape_interval: 10s

scrape_configs:
  - job_name: otel-collector-self
    static_configs:
      - targets: ["otel-collector:8888"]

  - job_name: otel-collector-application-metrics
    static_configs:
      - targets: ["otel-collector:8889"]
This file scrapes two endpoints:
otel-collector:8888is the Collector’s own/metricsendpoint.otel-collector:8889is the endpoint created by the Collector’sprometheusexporter for metrics that flowed through the metrics pipeline.
Prometheus can also receive OTLP metrics directly over HTTP when started with --web.enable-otlp-receiver (Prometheus OpenTelemetry guide). This demo does not use that path. Keeping Prometheus in pull mode makes the two local metrics paths easier to see.
This is a deliberate simplification. You can add OTLP ingestion later, but start with the version where every scrape target has a clear job.
Copy-Paste Quickstart
If you trust the three files above, this is the whole happy path:
docker compose up -d
docker compose run --rm telemetrygen-traces
docker compose run --rm telemetrygen-metrics
docker compose run --rm telemetrygen-logs
docker compose logs -f otel-collector
You should see ResourceSpans, ResourceMetrics, and ResourceLogs in the Collector logs.
The next sections walk through those commands and show what success looks like for each signal.
Run The Stack
Now prove the path.
Start the Collector, Prometheus, and Jaeger:
docker compose up -dCheck that the containers are running:
docker compose psOpen Prometheus in your browser:
http://localhost:9090Open Jaeger in your browser:
http://localhost:16686Send Test Traces, Metrics, and Logs
The stack is running, but it is empty. Send telemetry through it.
Run all three generators:
docker compose run --rm telemetrygen-traces
docker compose run --rm telemetrygen-metrics
docker compose run --rm telemetrygen-logs
telemetrygen is part of the OpenTelemetry Collector Contrib repository and is intended for generating traces, metrics, and logs for testing and demos (telemetrygen).
The commands above send OTLP over gRPC to otel-collector:4317.
If your SDK uses OTLP over HTTP, override one command and point it at 4318:
docker compose run --rm telemetrygen-traces \
  traces \
  --otlp-http \
  --otlp-endpoint=otel-collector:4318 \
  --otlp-insecure \
  --traces=3
That catches a common local mistake: HTTP telemetry sent to the gRPC port, or gRPC telemetry sent to the HTTP port.
Verify The Debug Exporter
Watch the Collector logs:
docker compose logs -f otel-collectorThe debug exporter is the local truth source. If it prints a signal, that signal reached the pipeline and made it to an exporter.
The exact output changes with Collector versions and verbosity level, but the shape is stable enough to recognize.
For traces, look for ResourceSpans:
ResourceSpans #0
ScopeSpans #0
Span #0
Name: lets-go
For metrics, look for ResourceMetrics:
ResourceMetrics #0
ScopeMetrics #0
Metric #0
Name: gen
For logs, look for ResourceLogs:
ResourceLogs #0
ScopeLogs #0
LogRecord #0
Body: log
If the Collector logs are silent after running telemetrygen, check these first:
- Is
telemetrygensending tootel-collector:4317from inside Docker? - Is the
otlpreceiver attached to the right pipeline? - Is the
debugexporter attached to that same pipeline? - Are you sending HTTP traffic to
4318and gRPC traffic to4317?
The failure mode is boring most of the time. A port, pipeline, or exporter name does not match the path you think you built.
Verify Traces In Jaeger
Open:
http://localhost:16686In the Jaeger UI, pick the telemetrygen service and search for traces.
If you do not see traces:
- confirm
docker compose run --rm telemetrygen-tracescompleted without errors - check
docker compose logs -f otel-collectorfor debug exporter trace output - check the Collector config has
otlp/jaegerin the traces pipeline - confirm the Jaeger service has
COLLECTOR_OTLP_ENABLED=true
The host does not need Jaeger’s OTLP port published. The Collector reaches Jaeger through Docker DNS at jaeger:4317.
Verify Application Metrics In Prometheus
The metrics generated by telemetrygen do not appear on :8888.
That is not a bug.
They flow through the Collector’s metrics pipeline and are exposed by the prometheus exporter on :8889.
In Prometheus, query:
{job="otel-collector-application-metrics"}If the metrics generator ran recently, you should see series from the Collector’s Prometheus exporter endpoint. Exact metric names can change with telemetrygen, but the job should return data.
Verify Collector Self-Metrics
The Collector’s /metrics endpoint tells you what the Collector is doing internally. This is where you check whether the Collector is accepting, refusing, exporting, or failing data.
From your host:
curl http://localhost:8888/metricsA successful response includes otelcol_* metrics. For example:
otelcol_receiver_accepted_spans_total{receiver="otlp",transport="grpc"} 12
otelcol_exporter_sent_spans_total{exporter="debug"} 12
In Prometheus, query the self-metrics scrape job:
{job="otel-collector-self", __name__=~"otelcol_.*"}For failures, start with receiver and exporter prefixes:
{job="otel-collector-self", __name__=~"otelcol_receiver_.*"}{job="otel-collector-self", __name__=~"otelcol_exporter_.*"}Metric names can vary across Collector versions and Prometheus translation settings, so prefixes are usually more useful than a perfect metric name on the first query.
What Just Happened
You proved three paths:
- Traces entered the Collector, printed through
debug, and appeared in Jaeger. - Metrics entered the Collector, printed through
debug, and appeared on the Prometheus exporter endpoint. - The Collector exposed its own internal health and pipeline counters on
/metrics.
That separation is the whole point of the lab. Application metrics and Collector self-metrics are different signals. Prometheus scrapes both here, but from different endpoints.
The otlp receiver is the entry point. It listens on the default OTLP ports: 4317 for gRPC and 4318 for HTTP (OTLP specification).
The debug exporter is not storage; it is a proof tool. The prometheus exporter exposes received metrics as a scrape endpoint on :8889.
For example, if traces appear in the debug exporter but not in Jaeger, stop investigating your SDK. The Collector received the spans. Your next suspect is the exporter path from the Collector to Jaeger.
Common Pitfalls
Start with the symptom. Then check the first likely break.
| Symptom | First place to check |
|---|---|
| No debug output | telemetrygen endpoint, receiver pipeline, debug exporter |
| Debug shows traces, Jaeger is empty | otlp/jaeger exporter and Jaeger OTLP setting |
| Prometheus self job works, app metrics are empty | telemetrygen-metrics, metrics pipeline, :8889 scrape target |
| App metrics work, self metrics are empty | service.telemetry.metrics, 8888 port binding |
| Works inside Docker, not from the host | published ports |
Three rules catch most mistakes:
- From a Compose service,
localhostmeans that container. Useotel-collector:4317. - A receiver, processor, or exporter is inactive until it appears in
service.pipelines. - Use
4317for OTLP/gRPC and4318for OTLP/HTTP.
For production, replace debug with real backends and keep internal metrics, pprof, zPages, and health endpoints private.
Success Checklist
You are done when:
- Collector logs show
ResourceSpansafter runningtelemetrygen-traces. - Collector logs show
ResourceMetricsafter runningtelemetrygen-metrics. - Collector logs show
ResourceLogsafter runningtelemetrygen-logs. - Jaeger shows traces for the
telemetrygenservice. - Prometheus job
otel-collector-application-metricsreturns generated metrics. - Prometheus job
otel-collector-selfreturnsotelcol_*metrics. - Failed exporter counters stay at zero.
If one item fails, do not debug everything. Follow the first broken link.
Optional Appendix
The main path above is intentionally small. Add these pieces only when they prove something you need.
Tail A Local Log File With filelog
The filelog receiver tails files and turns matching lines into OpenTelemetry log records (filelog receiver). You do not need it for the main path, but it is useful when the thing you need to test writes files.
Mount a local directory into the Collector:
otel-collector:
  volumes:
    - ./otelcol-config.yml:/etc/otelcol-contrib/config.yaml:ro
    - ./logs:/var/log/sample:ro
Add the receiver and attach it to the logs pipeline:
receivers:
  filelog/sample:
    include:
      - /var/log/sample/*.log
    start_at: beginning
    include_file_path: true

service:
  pipelines:
    logs:
      receivers: [otlp, filelog/sample]
      processors: [memory_limiter, batch]
      exporters: [debug]
Then write a line and watch the Collector:
mkdir -p logs
echo "hello from filelog" >> logs/app.log
docker compose restart otel-collector
docker compose logs -f otel-collector
Add Host Metrics With hostmetrics
The hostmetrics receiver collects CPU, memory, disk, filesystem, load, and network metrics (hostmetrics receiver). Keep it optional in this lab. Inside a container, host metrics can mean “container view” unless you add the right host filesystem mounts and root_path settings.
A starter receiver:
receivers:
  hostmetrics:
    collection_interval: 10s
    scrapers:
      cpu:
      memory:
      disk:
      filesystem:
      network:
      load:
Then add hostmetrics to the metrics pipeline receivers.
Add Collector Debugging Extensions
The Collector also has extensions for local troubleshooting:
extensions:
  health_check:
  pprof:
    endpoint: 0.0.0.0:1777
  zpages:
    endpoint: 0.0.0.0:55679

service:
  extensions: [health_check, pprof, zpages]
Publish ports only when you need them. These are local debugging tools. Keep them private.
Production Contrast
This local setup is intentionally small. It is a development harness, not a production architecture.
For production, change the harness:
- replace
debugwith durable telemetry backends - add authentication, TLS, retry, and queues where your backend requires them
- tune
batch,memory_limiter, and metric cardinality - monitor refused, dropped, and failed telemetry
- keep internal debugging endpoints private
- pin and test Collector upgrades
Do the local check before you blame the backend.
Once you can prove each hop locally, backend debugging becomes a smaller problem. You are no longer guessing where telemetry disappeared. You are following the first broken link.
References
- OpenTelemetry Collector
- OpenTelemetry Collector release v0.153.0
- OpenTelemetry Collector Contrib release v0.153.0
- Collector configuration
- Collector internal telemetry
- OTLP specification
- debug exporter package docs
- telemetrygen
- Jaeger deployment docs
- Prometheus release v3.5.3
- Prometheus OpenTelemetry guide
Written by Nicolas Narbais
I write about observability, OpenTelemetry, Tsuga, Datadog, and the practical work of making monitoring useful for engineering teams. I am also building Digitam to help teams reduce telemetry waste and improve observability outcomes.
Building an OpenTelemetry pipeline?
Explore more implementation guides and collector patterns for teams standardizing telemetry without adding unnecessary noise.